

Graph data science and machine learning for the detection of COVID-19 infection from symptoms
- Published
- Accepted
- Received
- Academic Editor
- Naeem Jan
- Subject Areas
- Bioinformatics, Artificial Intelligence, Data Mining and Machine Learning, Data Science, Emerging Technologies
- Keywords
- COVID-19, Knowledge graph, Graph algorithm, Machine learning, Symptoms, Detection, Automatic tuning, Ontology
- Copyright
- © 2023 Alqaissi et al.
- Licence
- This is an open access article distributed under the terms of the Creative Commons Attribution License, which permits using, remixing, and building upon the work non-commercially, as long as it is properly attributed. For attribution, the original author(s), title, publication source (PeerJ Computer Science) and either DOI or URL of the article must be cited.
- Cite this article
- 2023. Graph data science and machine learning for the detection of COVID-19 infection from symptoms. PeerJ Computer Science 9:e1333 https://doi.org/10.7717/peerj-cs.1333
Abstract
Background
COVID-19 is an infectious disease caused by SARS-CoV-2. The symptoms of COVID-19 vary from mild-to-moderate respiratory illnesses, and it sometimes requires urgent medication. Therefore, it is crucial to detect COVID-19 at an early stage through specific clinical tests, testing kits, and medical devices. However, these tests are not always available during the time of the pandemic. Therefore, this study developed an automatic, intelligent, rapid, and real-time diagnostic model for the early detection of COVID-19 based on its symptoms.
Methods
The COVID-19 knowledge graph (KG) constructed based on literature from heterogeneous data is imported to understand the COVID-19 different relations. We added human disease ontology to the COVID-19 KG and applied a node-embedding graph algorithm called fast random projection to extract an extra feature from the COVID-19 dataset. Subsequently, experiments were conducted using two machine learning (ML) pipelines to predict COVID-19 infection from its symptoms. Additionally, automatic tuning of the model hyperparameters was adopted.
Results
We compared two graph-based ML models, logistic regression (LR) and random forest (RF) models. The proposed graph-based RF model achieved a small error rate = 0.0064 and the best scores on all performance metrics, including specificity = 98.71%, accuracy = 99.36%, precision = 99.65%, recall = 99.53%, and F1-score = 99.59%. Furthermore, the Matthews correlation coefficient achieved by the RF model was higher than that of the LR model. Comparative analysis with other ML algorithms and with studies from the literature showed that the proposed RF model exhibited the best detection accuracy.
Conclusion
The graph-based RF model registered high performance in classifying the symptoms of COVID-19 infection, thereby indicating that the graph data science, in conjunction with ML techniques, helps improve performance and accelerate innovations.
Introduction
Viruses of the Coronaviridae family can cause several infectious diseases in humans and animals (Perlman, 2020). Diseases caused by these viruses, such as coronavirus disease (COVID-19), Middle East respiratory syndrome (MERS), and severe acute respiratory syndrome (SARS), can cause severe respiratory illnesses (Fadaka et al., 2020; Mosharaf et al., 2022).
Several outbreaks were caused by the MERS coronavirus, SARS coronavirus, and SARS coronavirus 2 (SARS-CoV-2) (Fehr, Channappanavar & Perlman, 2017). The most recent COVID-19 is an infectious disease that causes symptoms identical to those of influenza, such as fever, headache, fatigue, and a dry cough, and that can range from mild to severe respiratory disease. Critical cases of COVID-19 develop complications, such as acute kidney infections, cardiac infections, liver failure, and acute respiratory distress syndrome that causes long-term deterioration in lung function and arrhythmia, sometimes resulting in death (Mosharaf et al., 2022). As of December 29, 2022, the virus had caused of millions clinically confirmed cases and deaths (World Health Organization, 2019).
Although COVID-19 can be deadly, an accurate and early diagnosis with treatment can generally prevent critical illness and death. In most cases, elderly patients and those with a weak immunity system experienced severe illness, sometimes leading to death. Moreover, many challenges in COVID-19 detection have been discussed (Xu et al., 2020), including the difficulty in screening a large community for COVID-19 symptoms.
The reverse transcription polymerase chain reaction (RT-PCR) test has been applied in several studies (Pan et al., 2020; Yang et al., 2020; Graham et al., 2021) as a routine confirmation test for COVID-19 cases by the WHO and the Food and Drug Administration (Freeman, Walker & Vrana, 1999; Kageyama et al., 2003). Moreover, several studies have been conducted on detecting COVID-19 using serological tests (Zhang et al., 2020; Roda et al., 2021) and antigen tests (Peeling et al., 2020). Chest computed tomography (CT) scans are detailed chest X-rays that help identify the cause of the infection (Whiting, Singatullina & Rosser, 2015). CT studies (Chung et al., 2020; Xie et al., 2020) have significantly contributed to the detection of COVID-19. A comparative study showed that chest CT scans are more sensitive than RT-PCR (Ai et al., 2020; Fang et al., 2020). However, CT scans have low specificity, considering COVID-19 resembles other viral pneumonia cases (Ai et al., 2020).
Various detection techniques are currently available, each with their own advantages and disadvantages. Researchers have been working on developing other detection techniques with greater accuracy, better sensitivity and specificity, and shorter detection times (Taleghani & Taghipour, 2021).
One of the major challenges in the healthcare sector is an accurate, real-time, and affordable diagnosis of infectious diseases. An accurate diagnosis of infectious diseases is essential to provide better patient care and disease control and prevent further outbreak. Artificial intelligence (AI) is an emerging approach that effectively makes decisions and predictions by learning from a given dataset.
There are different techniques presented in literature to detect COVID-19 infection. However, a systematic review article (Alqaissi, Alotaibi & Ramzan, 2022) concluded that using heterogeneous data and extracting essential features increases the diagnostic performance of machine learning (ML) models. Additionally, creating a comprehensive graph from different heterogeneous data, such as ontologies, texts, and datasets, is advantageous. Moreover, applying ML techniques to a specific task is worthwhile.
The main motivation of this study is to overcome the limitations of previous studies for detecting COVID-19 infection from initial symptoms such as the long time taken by the model, missing important features, selecting a limited number of features for a small set of features, and manual tuning of hyperparameters. Our study creates an affordable, automatic, intelligent, rapid, and real-time diagnostic model to assist clinicians in triaging patients infected with COVID-19, particularly when healthcare resources are limited. Moreover, through COVID-19 KG, clinicians at the point of care can infer important information, such as COVID-19 complications, relationships, and proper medications. Our study demonstrates that using graph algorithms, such as fast random projection (FastRP), increases the prediction performance of ML models. Additionally, the automatic tuning of the hyperparameters applied in our study through ML pipelines produced optimized values for these hyperparameters, which maximized the predictive accuracy of the model.
The study’s contributions are as follows:
It demonstrates the process to scale up the adopted medical COVID-19 knowledge graph (KG), by importing data from different sources into one graph database.
Combining heterogeneous data sources can create a comprehensive COVID-19 KG, assist various relations understanding, and improve the performance of the ML models.
It demonstrates that graph algorithms support extracting essential features from the COVID-19 dataset.
It shows that graph data science, along with machine learning, improves the classification performance. Hence, it assists in creating an accurate diagnosis of COVID-19 infection.
The objectives achieved by this research are as follows:
Providing a mass screening method for rapid diagnosis of COVID-19 infection based on initial symptoms.
Extracting critical graph-based features from the current features and from various relationships presented in the dataset, particularly when there is limited data in the emerging infections.
Generalizing the proposed method to be possible for other infectious diseases.
Achieving a high-performance model for detecting COVID-19 at early stages.
To the best of our knowledge, this is the only study that combines COVID-19 KG that is constructed from heterogenous sources with the ML model to classify COVID-19 infection from symptoms in the initial stage. The main reason to apply GDS in our study is to enhance ML pipeline prediction through graph-based feature engineering. Different graph algorithms could be applied to answer various analytical questions from the whole KG and from the specific dataset graph.
The remainder of this article is organized as follows. “Literature review” provides an overview of related literature and a comparison with previous studies in the field. “Methodology” discusses the method used in this study, including the COVID-19 KG, the implemented graph algorithm, the developed graph-based ML pipelines, and the configuration of automatic hyperparameter tuning. “Results and discussion” presents the results obtained by implementing the proposed graph-based ML models and discusses their performance as compared with those of other models. Finally, “Conclusions” concludes the article.
Literature review
Applying a deep convolutional neural network-based system can help in the rapid and low-cost detection of COVID-19 from computerized tomography (CT) scans or X-ray images (Jin et al., 2020). A study used a transfer learning approach to rapidly screen infected COVID-19 patients using chest X-rays (Sharma, Rani & Gupta, 2020). Another study integrated the chest CT findings with clinical information to diagnose COVID-19 in patients with the highest accuracy (Mei et al., 2020). Although it used a pretrained tuberculosis model to distinguish COVID-19 from other diseases that cause respiratory illnesses, some examples had an unclear explanation.
Mercaldo et al. (2023) applied an automatic and rapid detection of COVID-19 infection based on 18,000 lung CT scans for 45 patients. They relied on deep learning to distinguish between COVID-19 infection, other pulmonary infection, and healthy patients. Their main contribution is to highlight the areas in lungs infected by COVID-19 in the images.
Automated voice-based COVID-19 detection techniques use recurrent neural networks to classify COVID-19 infections and can facilitate COVID-19 screening (Pinkas et al., 2020). However, the symptoms should be assessed and quantified using reliable reports or sensor-based acquisition. Additionally, cross-validation yielded low performance with a recall of 78% and a probability of false alarm of 30%. On the other hand, Mayet et al. (2023) developed a self-diagnosis application to detect COVID-19 infection through breath testing analysis at early stages. They applied a dummy and random real-time dataset with four parameters for lung volumes, seven parameters for spirometry, and four parameters for lung capacities. Regardless of the lower accuracy, their work engaged in the medical field for diagnosing other infections and for inventing a medical application that will aid clinicians in their practice.
Zoabi, Deri-Rozov & Shomron (2021) applied basic information and clinical symptoms to detect COVID-19 infections using a baseline model with simple features, including age, sex, cough, breathing difficulty, fever, sore throat, headache, and known contacts with confirmed COVID-19 cases. For the prospective test set with 95% confidence intervals of 0.892–0.905, their model achieved an area under the receiver operating characteristic curve (AUROC) value of 0.90. With a positive predictive value of 0.66 and 95% confidence intervals of 0.67–0.678, the diagnosis had high sensitivity but low area under the precision–recall curve. Furthermore, the study utilized simulated test data by removing negative values and filtering high-bias symptoms from the dataset. However, most baseline models lack complexity and are not highly predictive. Moreover, more symptoms should be included, such as the lack of smell and taste.
Another study developed classical and ensemble ML algorithms, including logistic regression (LR) and naive Bayes (NB), to classify textual clinical reports of COVID-19 based on signs and symptoms (Khanday et al., 2020). Furthermore, several feature-engineering techniques were employed. There were 24 features in the dataset collected from GitHub—an open-source data repository of 212 patients. The study concluded that more feature engineering and data were required.
Clinical data with 42 features including age, sex, reported symptoms, presence, type of comorbidities, and current medication were collected from the emergency department using artificial neural networks (ANNs) and other ML systems (Langer et al., 2020). Based on the clinical data, adequately trained ANNs and ML systems can be used to accurately predict COVID-19 infection.
Antoñanzas et al. (2021) collected demographic, epidemiological, clinical, and microbiological data to detect COVID-19 infections. They specified 26 features for predictive model training. The ML model accurately predicted COVID-19 in children with an AUROC of 0.65. The study highlighted the challenges of combining clinical characteristics and complex interactions between symptoms for predicting COVID-19 infection in children. However, a large sample size is required to improve the AUROC results, considering some missing values limit the performance of the model-learning approach.
Two studies by Villavicencio et al. (2021, 2022) analyzed the same COVID-19 symptom dataset. One utilized five supervised ML techniques, namely the support vector machine (SVM), random forest (RF), NB algorithms, k-nearest neighbor, and J48 decision tree, using WEKA machine learning software (Villavicencio et al., 2021). The performance of each model in terms of primary accuracy measures, mean absolute error (MAE), latency, and kappa was assessed by applying 10-fold cross-validation. They showed that the SVM outperformed other ML methods in terms of accuracy and MAE. The study by Villavicencio et al. (2022) used the same ML algorithms as that in 2021 along with an ANN for 18 selected features. Furthermore, the performance measures in Villavicencio et al. (2022) compared the accuracy, specificity, sensitivity, and AUROC of the six models. This study used a web application that allows users to manage their COVID-19 health status in real time without undergoing laboratory tests.
Azeli et al. (2022) used the simple olfactory dysfunction symptom, which is a common symptom of COVID-19 disease, for rapid and early detection of COVID-19 infection. They applied an olfactory dysfunction test to identify the smell of hydroalcoholic gel. Then, they developed a LR model to find relevant symptoms. After that, they experimented with a classification tree model and a recursive partitioning algorithm on a combination of these symptoms and the olfactory test results to detect the infections. Azeli et al. (2022) obtained an area under the curve of 0.87, a specificity of 0.39, and a sensitivity of 0.97.
Alemi et al. (2023) presented logistic regression models to develop a computerized symptoms screening method to improve the diagnostic accuracy of COVID-19 for the at-home antigen test. They used two different data samples collected on two distinct periods to train and validate the final model. They proved that their computerized symptoms screening model increased the accuracy of the at-home antigen test by 20% with 50 possible combinations of symptoms.
Internet of things (IoT) supports the real-time and remote screening of patients during a pandemic. Pal et al. (2022) combined IoT and ML to detect COVID-19 from symptoms. They suggested that sensors will collect patients’ data for processing, which will assist clinicians at the point-of-care.
Two least absolute shrinkage and selection operator (LASSO) regression models were developed by Wojtusiak et al. (2023) to predict COVID-19 infection from the order of occurrence of symptoms. Wojtusiak et al. (2023) tested a time-sensitive model against a time-insensitive one with the same data. Additionally, the average cross-validated area under the receiver operating characteristic (AROC) curve showed that the time-insensitive model had an AROC curve of 0.784, which is lower than the 0.799 of the time-sensitive model.
The various methods used to diagnose COVID-19 had limitations, such as cost, time required, equipment dependence, availability of trained healthcare workers, shortage of testing kits, and interoperate variability. Recent studies show that ML algorithms can detect COVID-19, predict cases, reduce its spread, minimize the number of deaths, and most importantly, relieve doctors and nurses of some of their workload to improve the quality of healthcare (Jernigan, Low & Helfand, 2004; Whiteside et al., 2020).
At present, many studies are being conducted on COVID-19 as well as the spectrum of symptoms it produces. Using the clinical signs and symptoms, we developed a graph-based ML model to screen for COVID-19. Health systems can achieve optimal resource management by improving clinical priorities during future pandemics. This management is crucial in developing countries with limited resources (Mark et al., 2020). Additionally, we compared the accuracy of the proposed graph-based RF model with that of other models proposed in the literature. Table 1 presents a comparative analysis for the main advantages and limitations between these different studies and the proposed method presented in this article. Moreover, we compared our results with those of the state-of-the-art study (Villavicencio et al., 2022), which achieved the highest accuracy of 98.84% and used the same COVID-19 dataset.
| References | ML algorithms | Accuracy | Dataset | Advantages | Limitations |
|---|---|---|---|---|---|
| Khanday et al. (2020) | Multinomial NB and LR | 96.2% | 212 clinical reports |
|
|
| Langer et al. (2020) | ANN | 91.4% | Clinical data of 199 patients |
|
|
| Zoabi, Deri-Rozov & Shomron (2021) | Gradient-Boosting with Decision Tree | 95% | 99,232 records |
|
|
| Antoñanzas et al. (2021) | RF | Not measured. | 4,456 records |
|
|
| Villavicencio et al. (2021) | SVM | 98.81% | 5,434 instances |
|
|
| Villavicencio et al. (2022) | RF, SVM, ANN, and k-NN | 98.84% | 5,434 instances |
|
|
| Azeli et al. (2022) | Decision tree | Other measures | 519 patients. |
|
|
| Pal et al. (2022) | k-NN | 97.97% | 5,434 samples. |
|
|
| Mayet et al. (2023) | LR | 90% | 11,000 entries |
|
|
| Mercaldo et al. (2023) | Transfer leaning model | 95% | 18,000 images of pulmonary CT scans |
|
|
| Alemi et al. (2023) | LR | 94.5% | 835 individuals’ data |
|
|
| Wojtusiak et al. (2023) | LASSO regression models | Not measured. | 483 demographics and symptoms data |
|
|
| Proposed method | Graph-based RF | 99.36% | 5,434 instances |
|
|
Methodology
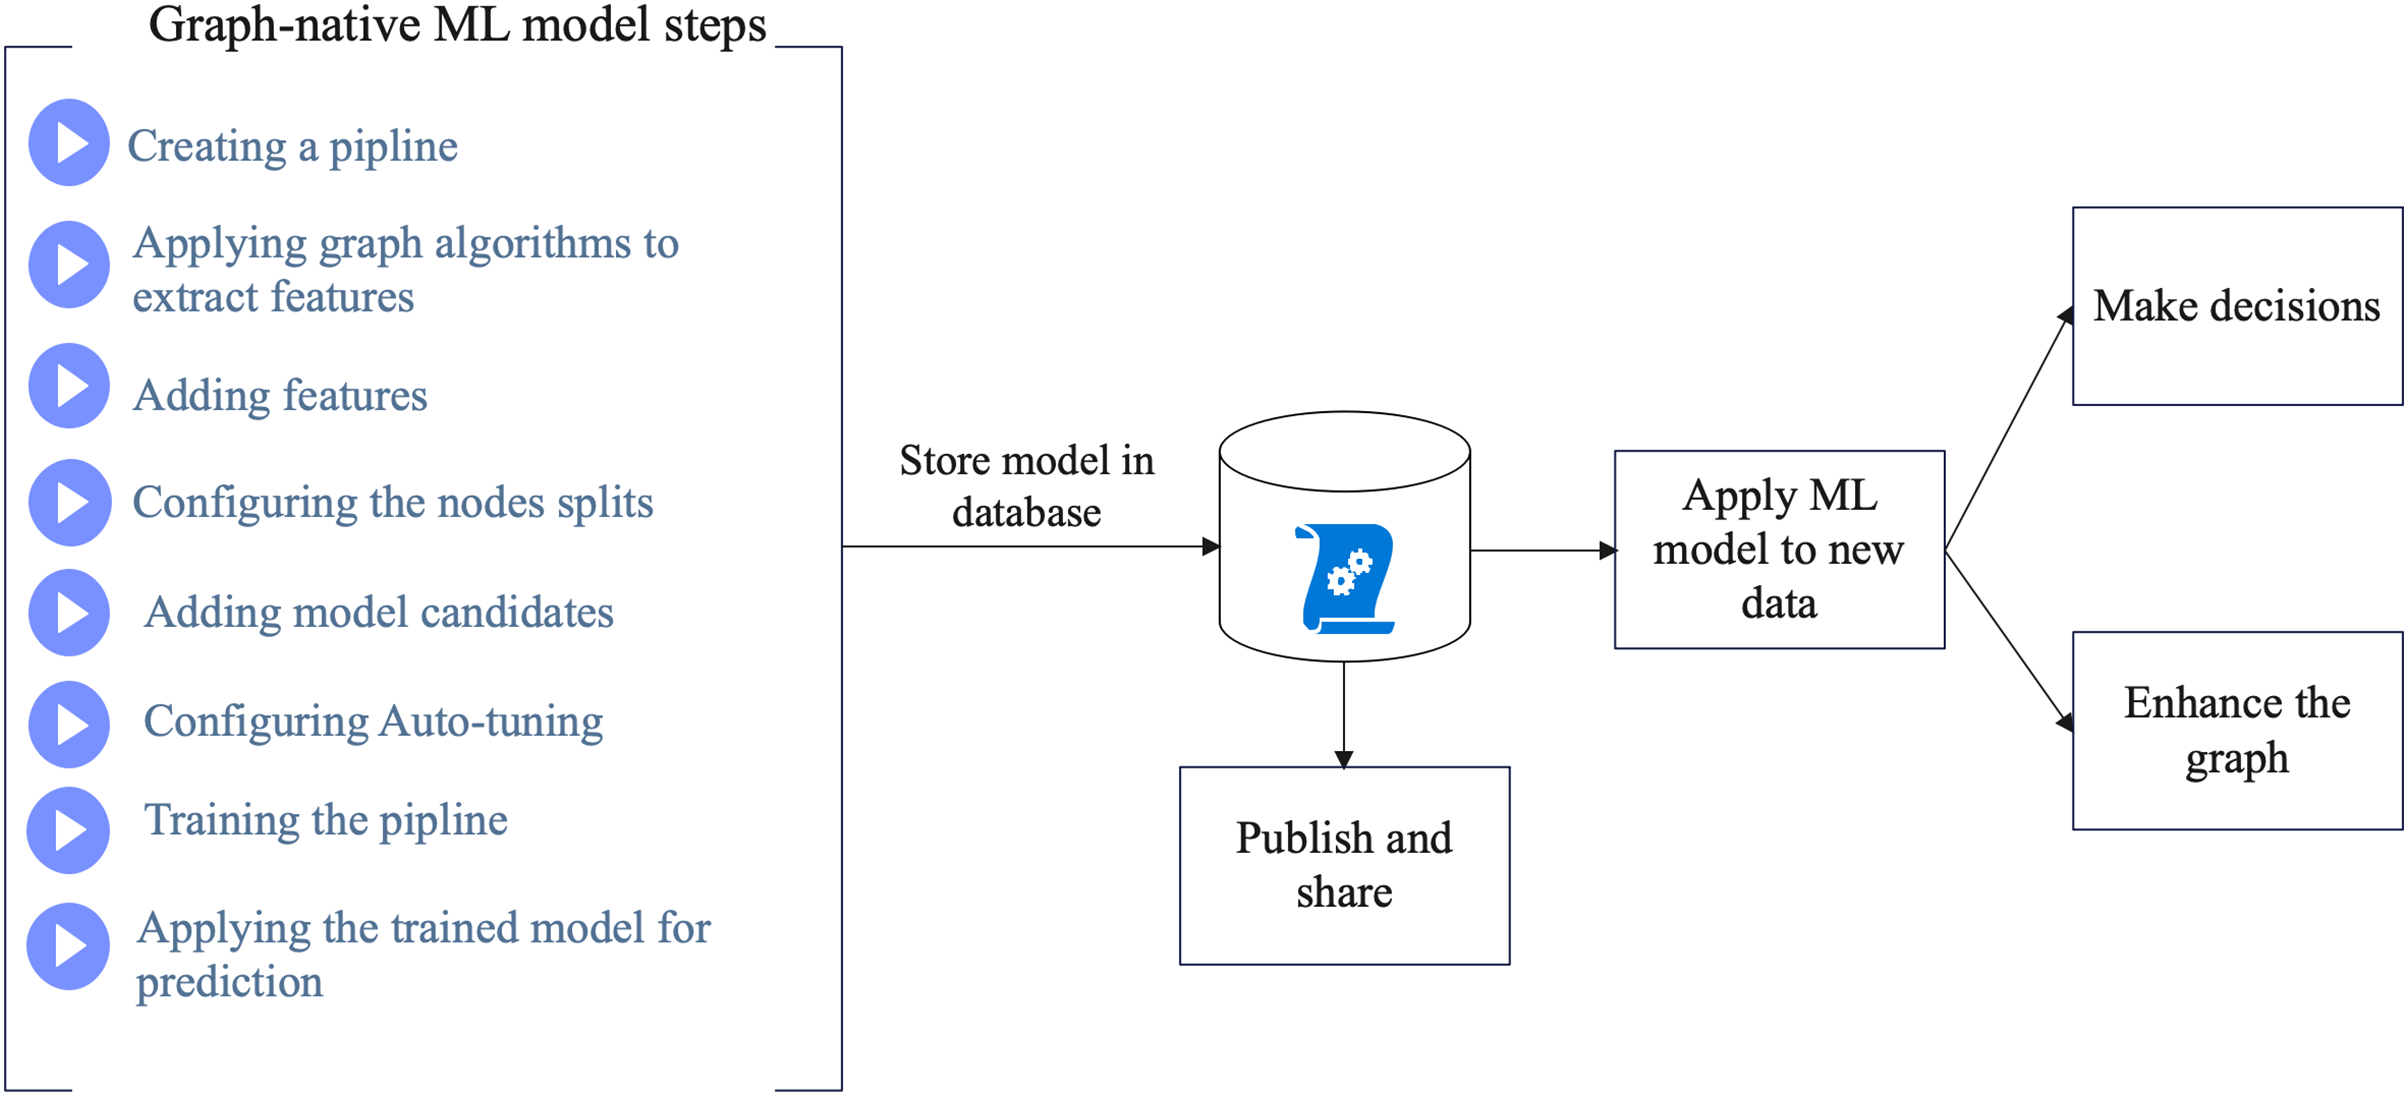
First, we constructed the proposed KG. Then, we created and configured ML pipelines to perform the node classification process on the graph of the COVID-19 dataset. The model catalog stores the best model candidates to make predictions. Figure 1 shows a schematic of the proposed method. In Fig. 1, the proposed method starts by creating the graph-based ML model through several steps. Then, the created model will be stored in the database where it can be published and shared for training new datasets. The overall process will assist making decisions and enhancing the KG.
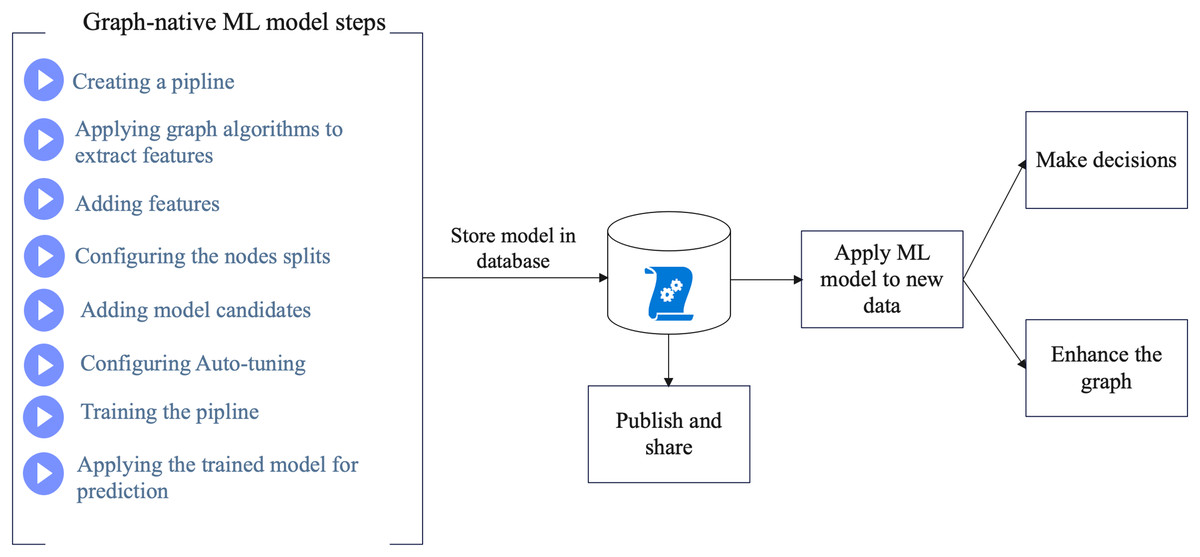
Figure 1: Schema of the proposed method.
COVID-19 knowledge graph (KG)
A KG facilitates the representation and integration of heterogeneous data and their relationships. To understand COVID-19 relationships, extracting and integrating knowledge from the biomedical literature and databases is valuable. This study used the medical COVID-19 KG developed by Chen et al. (2021). Furthermore, we can use an RDF query language (SPARQL) endpoint to import this comprehensive COVID-19 medical KG into our proposed graph database and ingest human disease ontology (HDO) into the Neosemantics RDF toolkit of the Neo4j graph database.
There were approximately 24 named graphs in the COVID-19 KG. We used COVID-19 KG of Chen et al. (2021) to assist in the node classification process in detecting COVID-19 from the symptoms. Table 2 summarizes the data sources used in the COVID-19 KG.
| References | Name | Brief description | Format |
|---|---|---|---|
| Chen, Allot & Lu (2021) | LitCovid | COVID-19 articles from the LitCovid corpus. | BioC-JSON |
| Wang et al. (2020) | CORD-19 | Metadata for COVID-19 open research dataset. | BioC-JSON |
| Rosemblat et al. (2013) | SemRep | Uses the Unified medical language system (UMLS) to extract semantic predictions from biomedical text. | RDF |
| Ren et al. (2018) | iTextMine | The protein phosphorylation (kinase-substrate-site) of LitCovid abstract mined by RLIMS-P. | RDF |
| Wei et al. (2019) | PubTator | Annotates biomedical concepts such as gene and protein, disease, drug and chemical cell type, species, and different genomic variants. | RDF |
| Chen et al. (2020) | Protein ontology | Contains protein ontology terms related to the SARS-CoV-2 coronavirus. | RDF |
| Wishart et al. (2018) | DrugBank | Combines detailed drug data with comprehensive drug target information in unique bioinformatics and cheminformatics resource. | RDF |
| Raybould et al. (2021) | CoV-AbDab | Coronavirus-binding antibody sequences and structures. | RDF |
| Apweiler et al. (2004) | UniProtKB | Provides a comprehensive, well-classified, highly accurate protein sequence knowledge base. | RDF |
| Szklarczyk et al. (2019) | STRING | Gives known and predicted human protein-protein interactions. | RDF |
| Huang et al. (2018) | iPTMnet | This resource is a bioinformatics tool to learn about protein post-translational modifications (PTMs) in systems biology. | RDF |
| Schriml et al. (2022) | HDO | Comprises 18,019 classes covering infectious diseases, transmission processes, pathogens, and symptoms. | RDF |
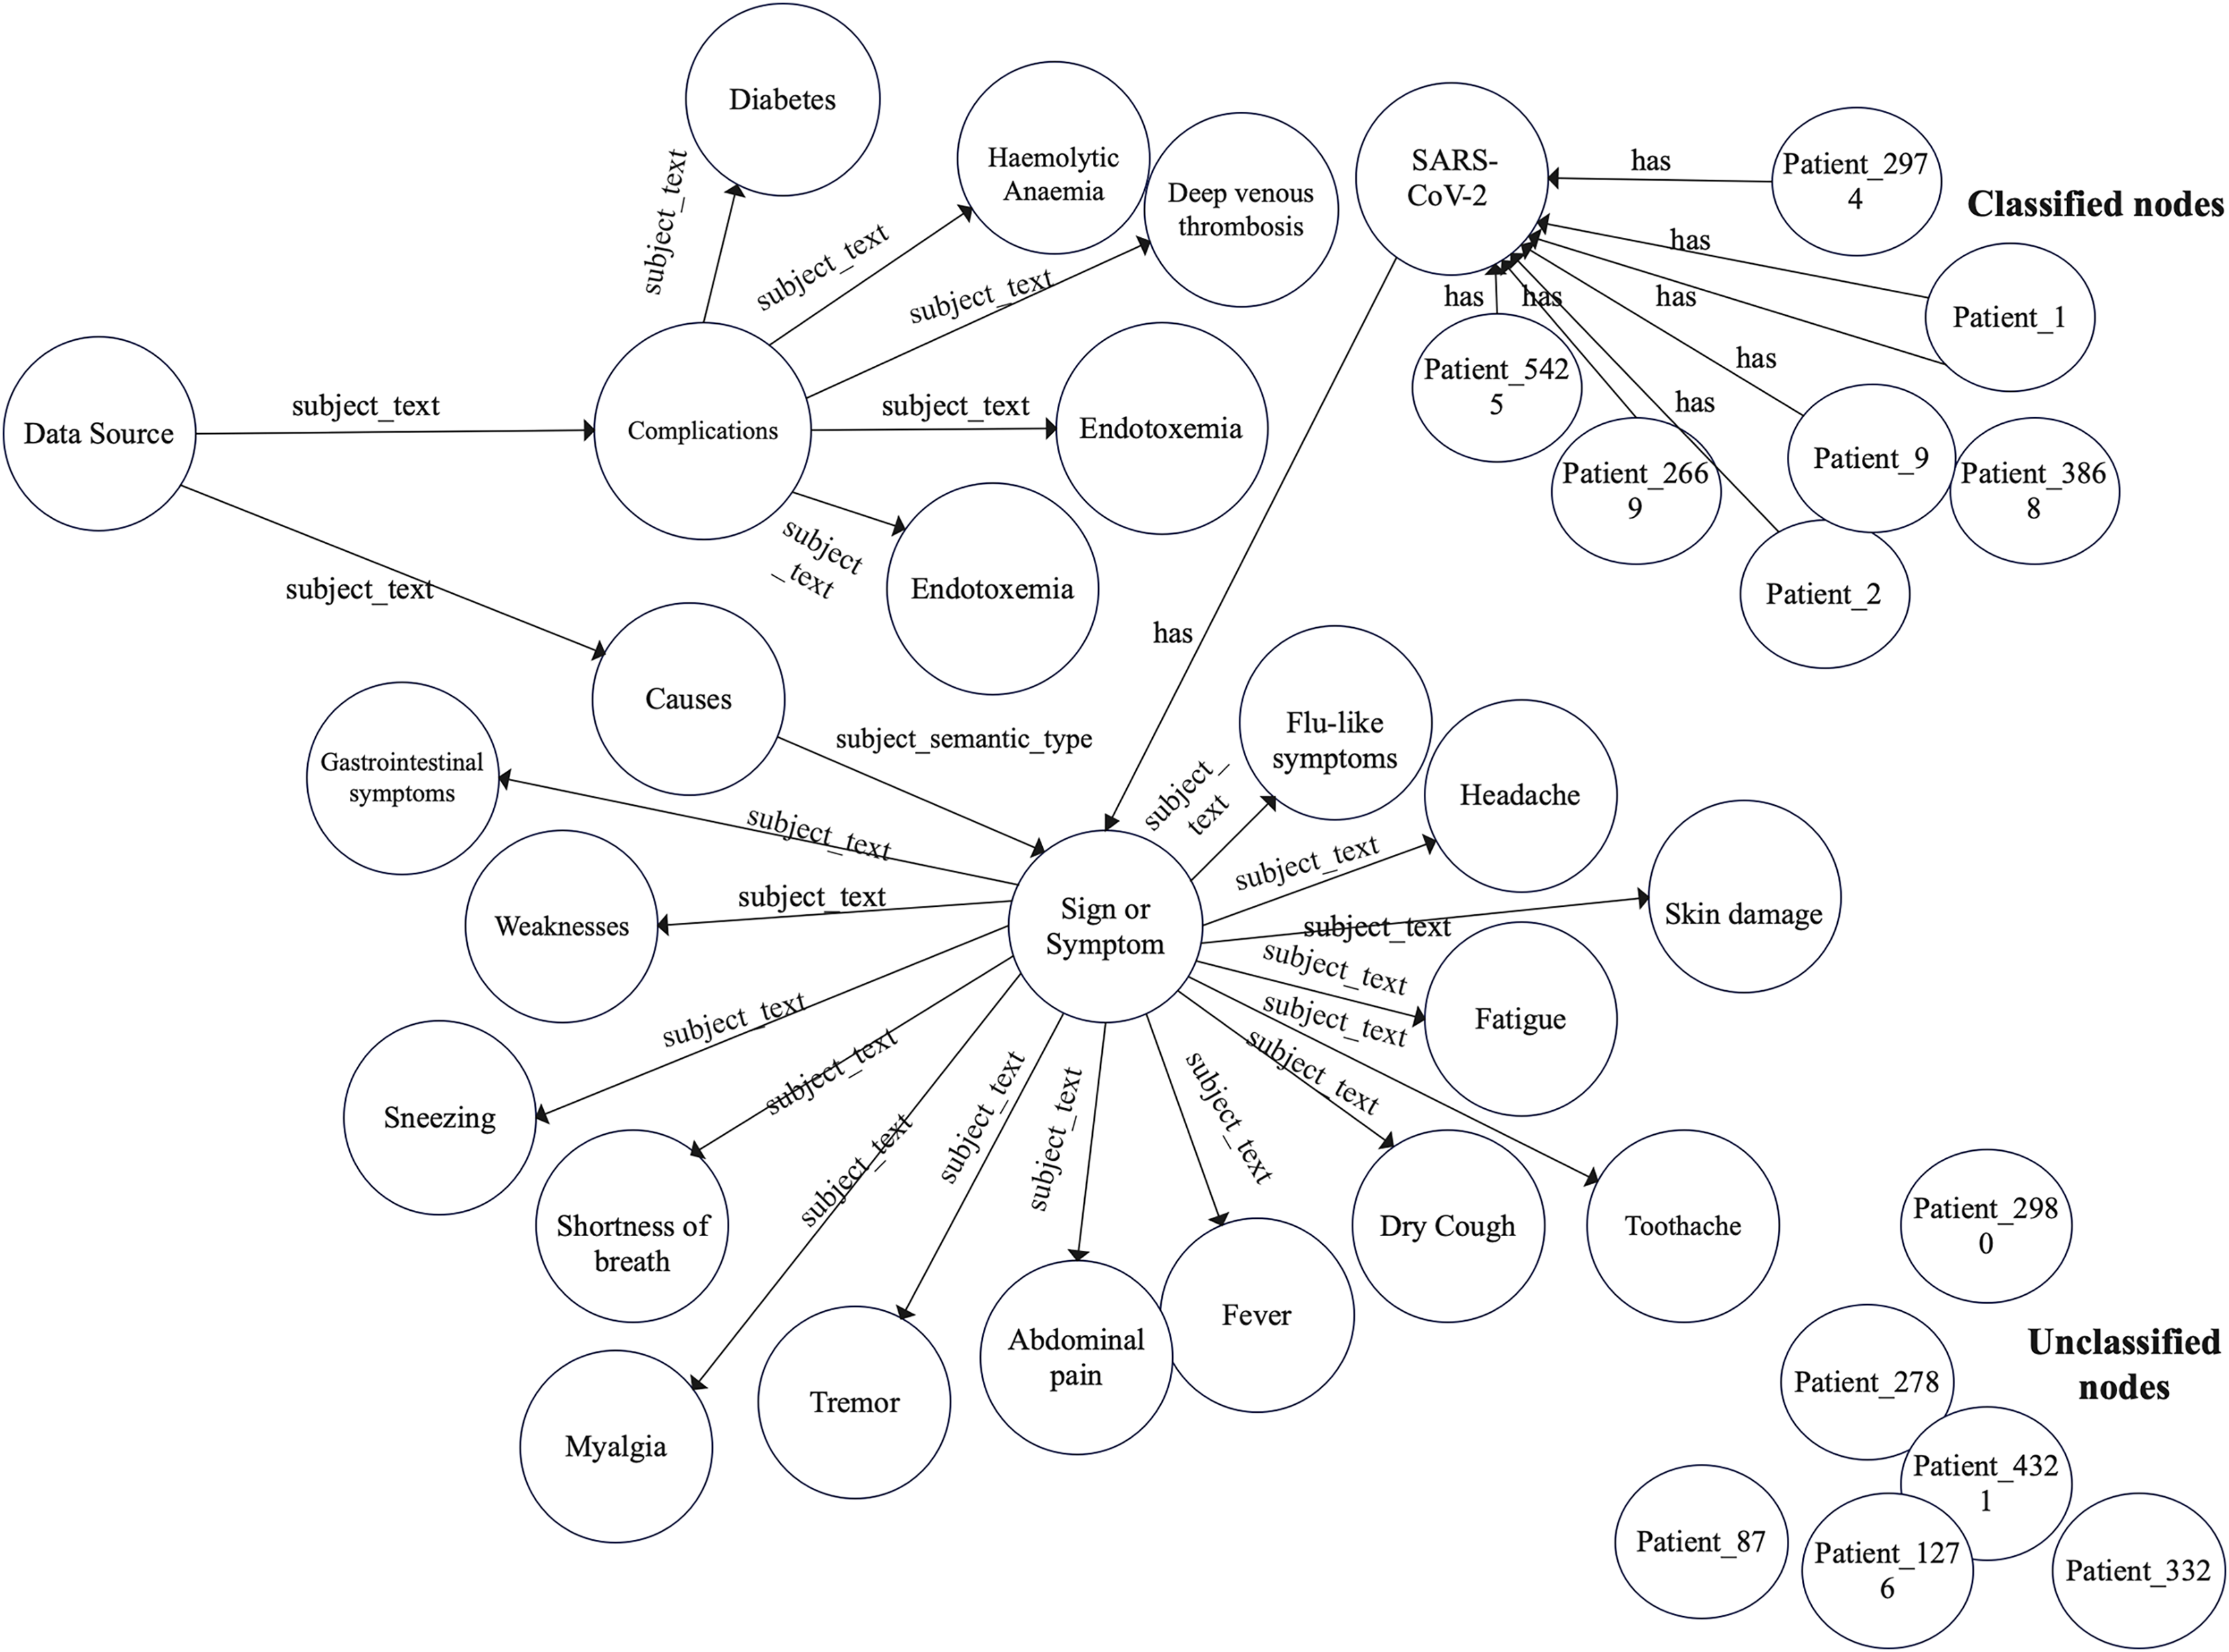
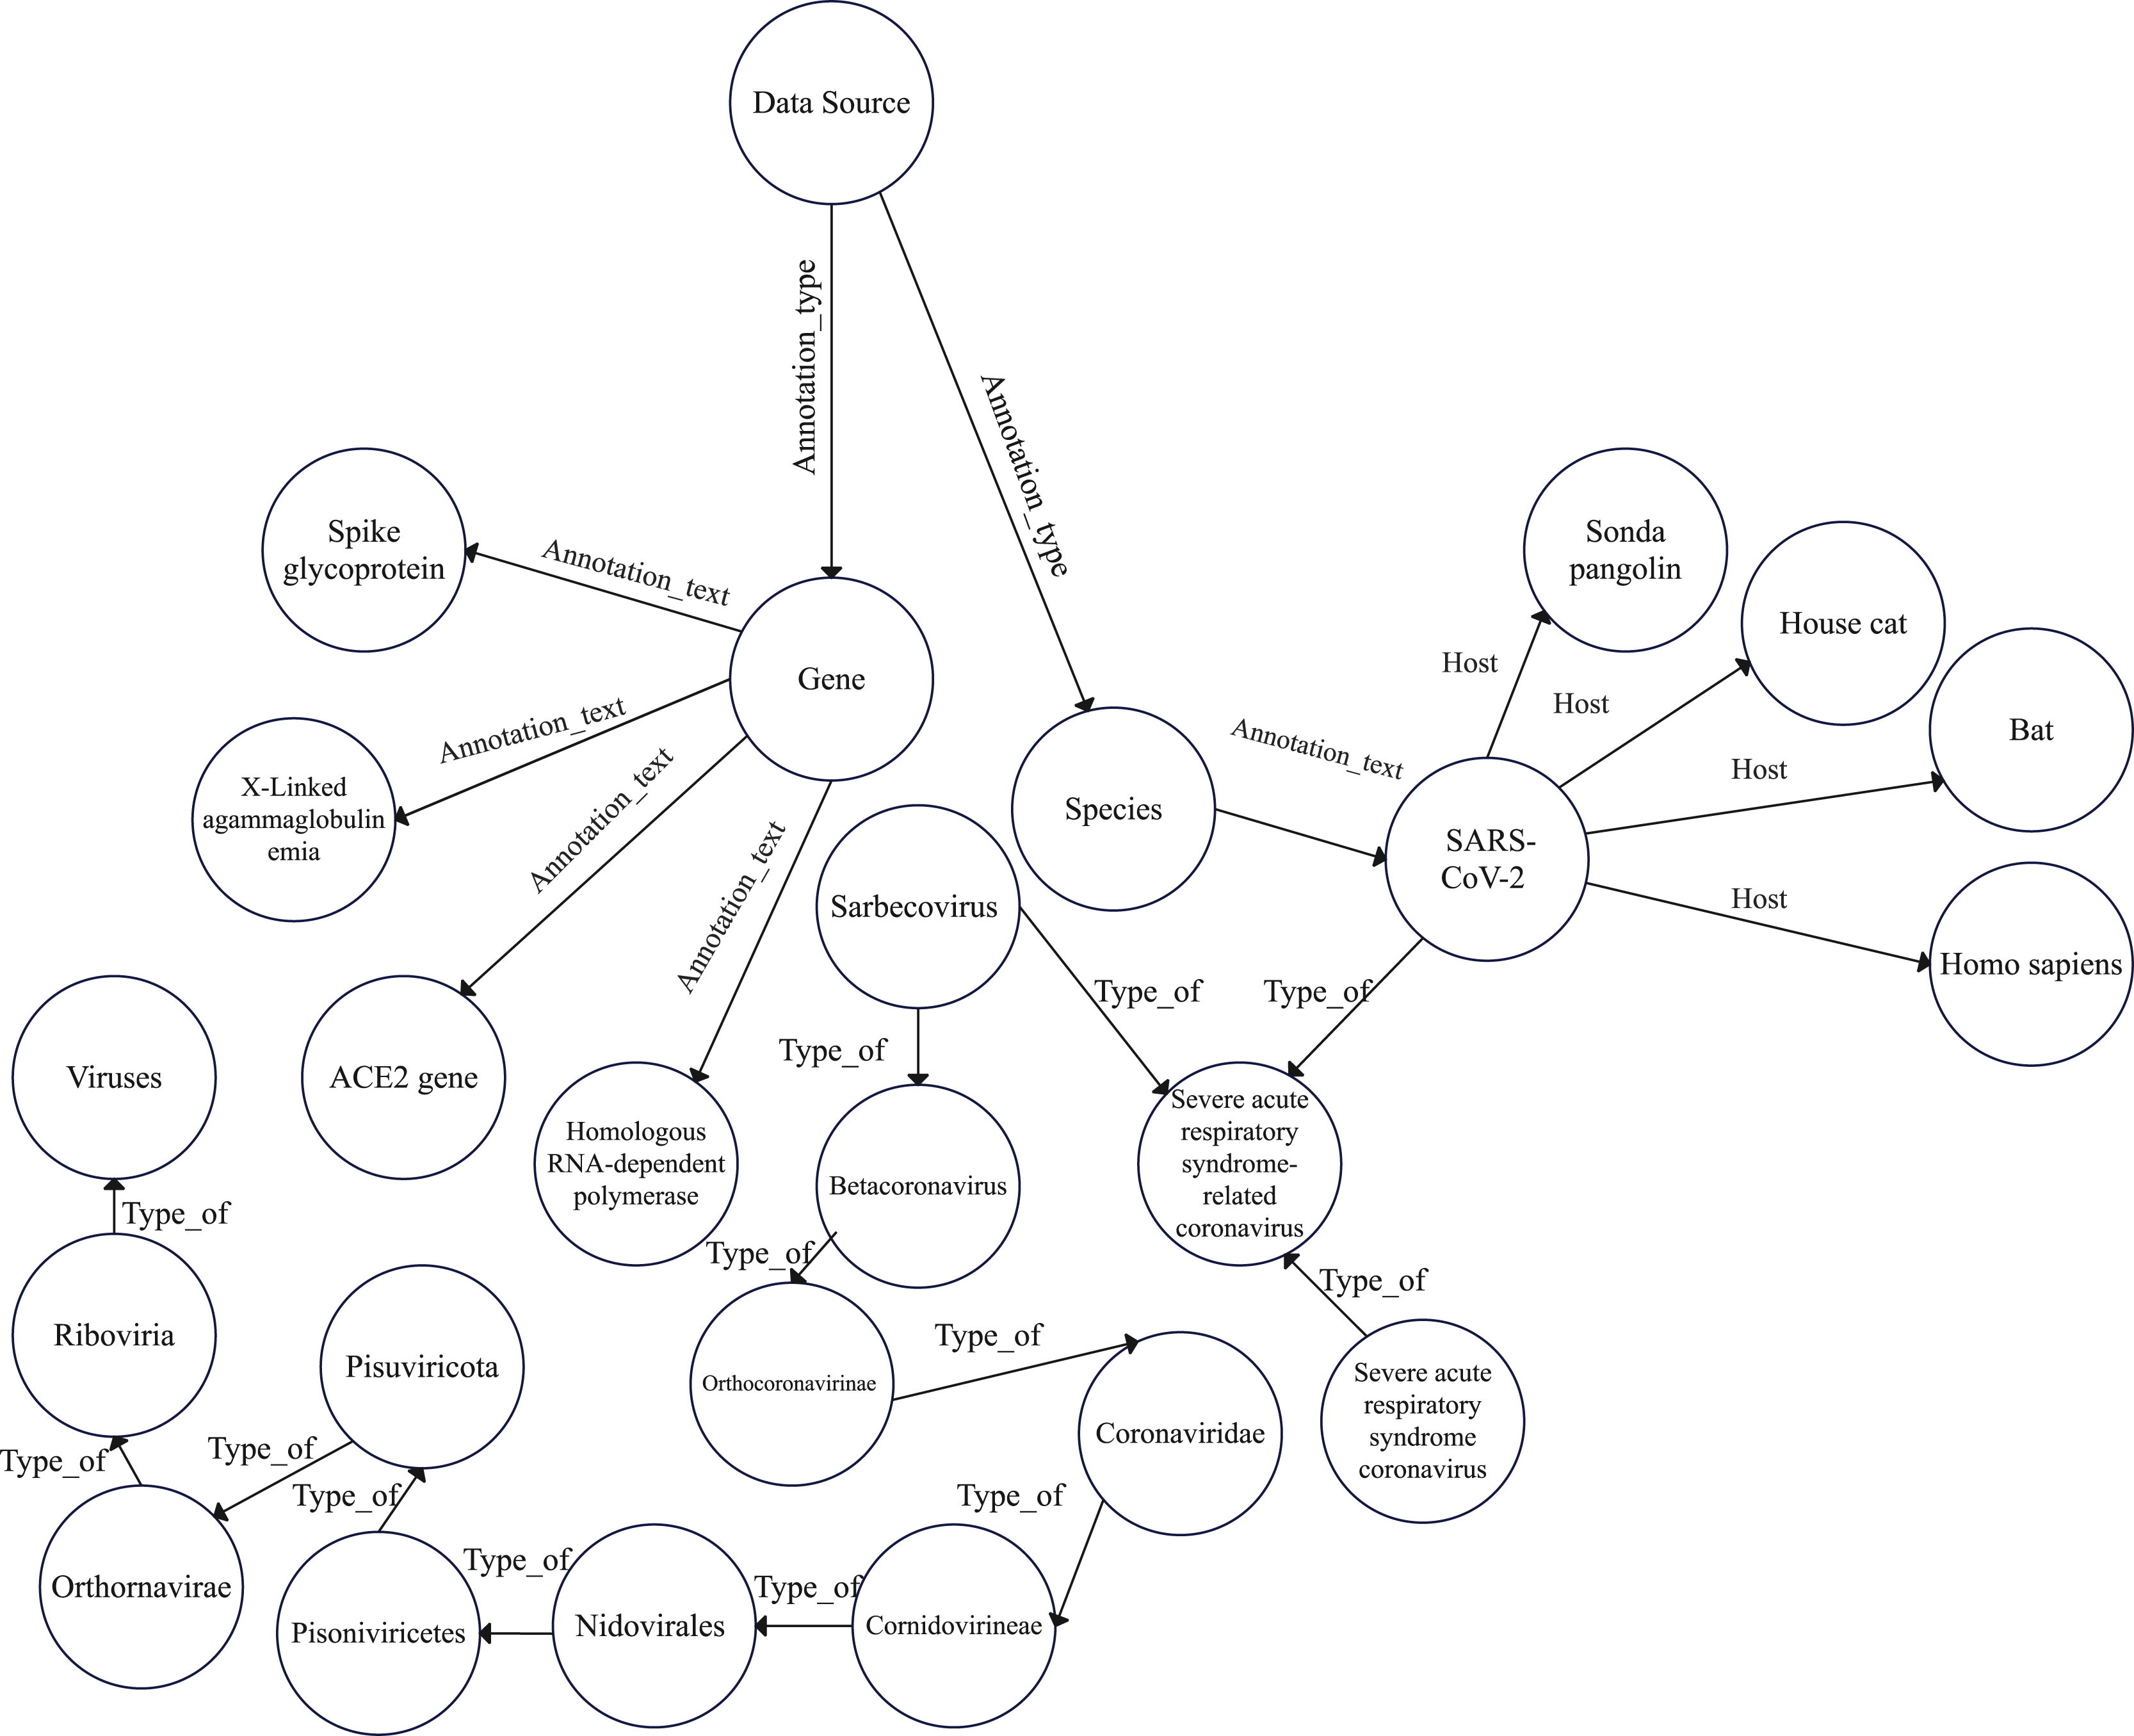
Accordingly, we constructed a graph data model to construct the COVID-19 graph database. Furthermore, we imported the COVID-19 dataset described in “COVID-19 dataset”. Figures 2 and 3 show a part of the COVID-19 KG and datasets, which include valuable information, such as signs and symptoms, complications, genetic sequencing, and medications, which can be helpful in clinical decisions. After importing the COVID-19 dataset, we linked the dataset with the COVID-19 KG, which enables the reading of all presented relationships. For example, patient 9 in the dataset was infected with SARS-CoV-2, which has several hosts, including bats. Fever, dry cough, and shortness of breath are symptoms of COVID-19. Endotoxemia and hemolytic anemia are possible complications of COVID-19. In this step, several graph algorithms could be applied such as node embeddings, topological link prediction, and similarity algorithms.
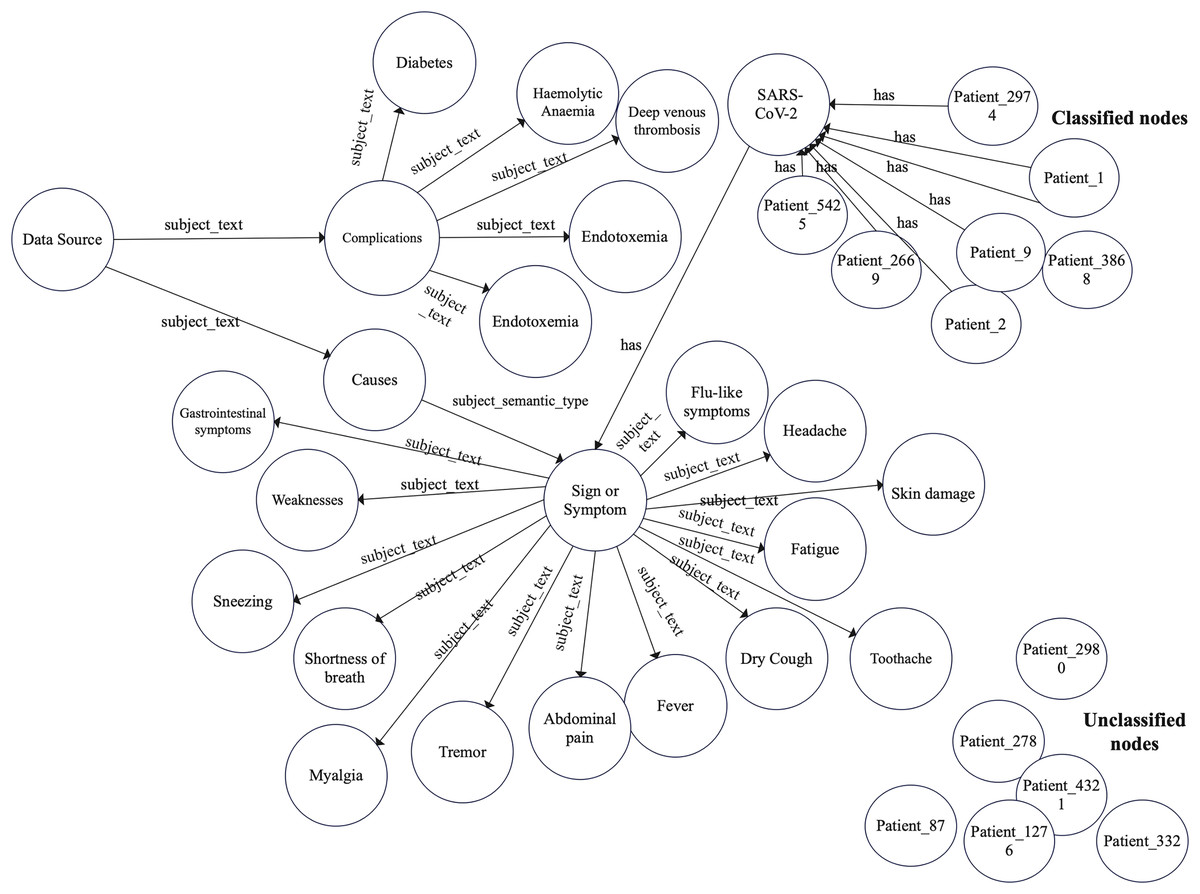
Figure 2: Graph model schema of complications and symptoms with classified and non-classified nodes.
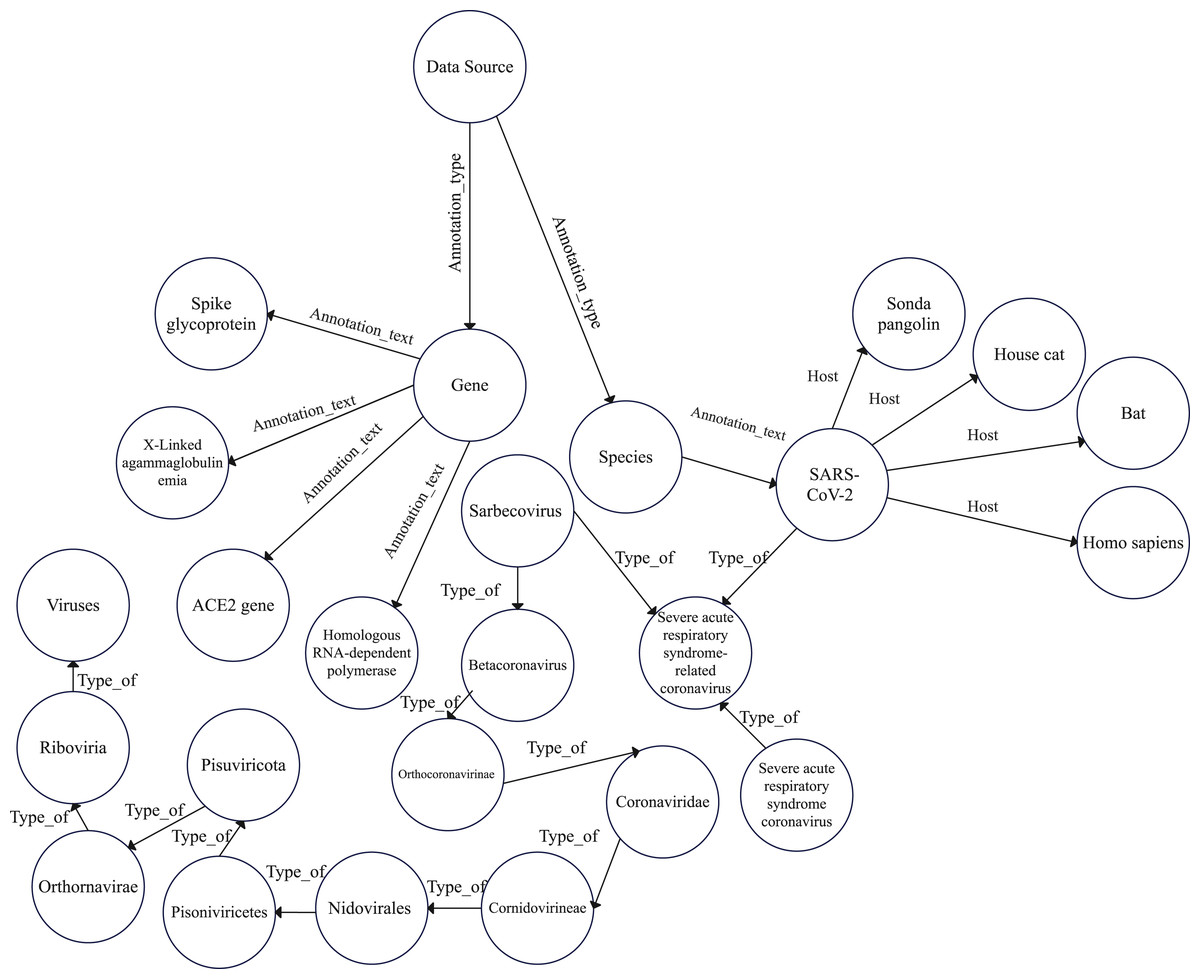
Figure 3: Graph model schema of COVID-19 hierarchy.
COVID-19 dataset
We relied on the COVID-19 dataset previously analyzed in studies by Villavicencio et al. (2021, 2022) and Pal et al. (2022) to detect COVID-19 infections. The dataset comprises 5,434 rows and 21 features and is publicly available on Kaggle (2020) and entitled “COVID-19 Symptoms and Presence.” The COVID-19 dataset was imbalanced with no missing values. Table 3 displays its features and their description. This dataset is public, and it is sourced from all India institute of medical sciences (AIIMS) and the WHO. To process imbalance class distribution in the dataset, we performed a stratified cross-validation on the training graph only.
| Feature | Description |
|---|---|
| Breathing problem | A person is feeling short of breath. |
| Fever | It is above average temperature. |
| Sore throat | Throat pain is present in the individual. |
| Asthma | Asthma is present in the individual. |
| Dry cough | There is continuous coughing without phlegm. |
| Chronic lung disease | There is a lung disease in the individual. |
| Running nose | An individual is suffering from a runny nose. |
| Diabetes | The individual has diabetes or has a history of it. |
| Headache | A headache is present in the individual. |
| Fatigue | The individual feels tired. |
| Heart disease | The individual has cardiovascular disease. |
| Gastrointestinal | The individual has some gastrointestinal problems. |
| Hypertension | It implies a high blood pressure. |
| Contact with the COVID-19 patient | The patient has contact with COVID-19-infected individuals. |
| Abroad travel | The individual traveled out of the country recently. |
| Attended large gathering | The individual or a member of the family attended a large gathering. |
| Family working in public exposed places | The individual or any family member works in a crowded location such as a market or hospital. |
| Visited public exposed places | Recently visited public places. |
| Sanitation from market | The individual sanitizes products bought from a market before use. |
| Wearing masks | The individual is wearing face masks properly. |
| COVID-19 | Indicates the presence or absence of COVID-19. |
The COVID-19 dataset has an imbalanced class distribution with 4,383 and 1,051 instances of infected and not infected individuals, respectively. Stratified k-fold cross-validation was applied to deal with the imbalanced COVID-19 dataset. Furthermore, we transformed the nominal data into a numeric representation by replacing every yes and no value with the number 1 and 0, respectively.
Feature extraction process
The feature selection process in Villavicencio et al. (2022) included the Pearson correlation coefficient, variance threshold, and variance inflation factor to select positively correlated features. Moreover, the authors included negatively correlated features. However, they considered that the WHO should determine the common symptoms of COVID-19 considering it has been updated regularly and validated by medical experts. Finally, only 16 features were selected for the training process of their models.
The reduction of a vast number of features of the dataset helped remove the less important features and reduce the overfitting problem. However, it is advisable to include all given features in the case of a small set of features. Additionally, we used the fast, accurate, and direct learning embeddings algorithm named FastRP algorithm (Chen et al., 2019) to add a new feature to the COVID-19 dataset. Because the graph of the COVID-19 dataset is very sparse, we applied the FastRP algorithm to learn the distributed node representations. A node-embedding algorithm preserves the similarity between the nodes and their neighbors, which indicates that pairs of nodes with similar neighbors are assigned identical embedding vectors, as shown in Eq. (1):
(1)
Here, normalize is a division of a vector with its L2 norm. w is the node self-influence (measures the node embedding affected by the immediate embedding through iteration weights (w1,w2,…,wk)), and is a random vector of nodes.
COVID-19 detection using ML pipelines
Graph data science (GDS) and ML techniques were implemented in various studies. For example, Rudd (2018) used both approaches to classify diabetes, and Jalili (2017) used them to analyze Alzheimer’s disease. Node classification (binary node classification in our study) is a common ML task applied to graphs and is used to train models to classify unlabeled nodes based on the properties of other nodes. In our study, the training pipeline starts by augmenting the graph with new node properties (FastRP) along with all node features. Subsequently, the augmented graph was used to train the classification model.
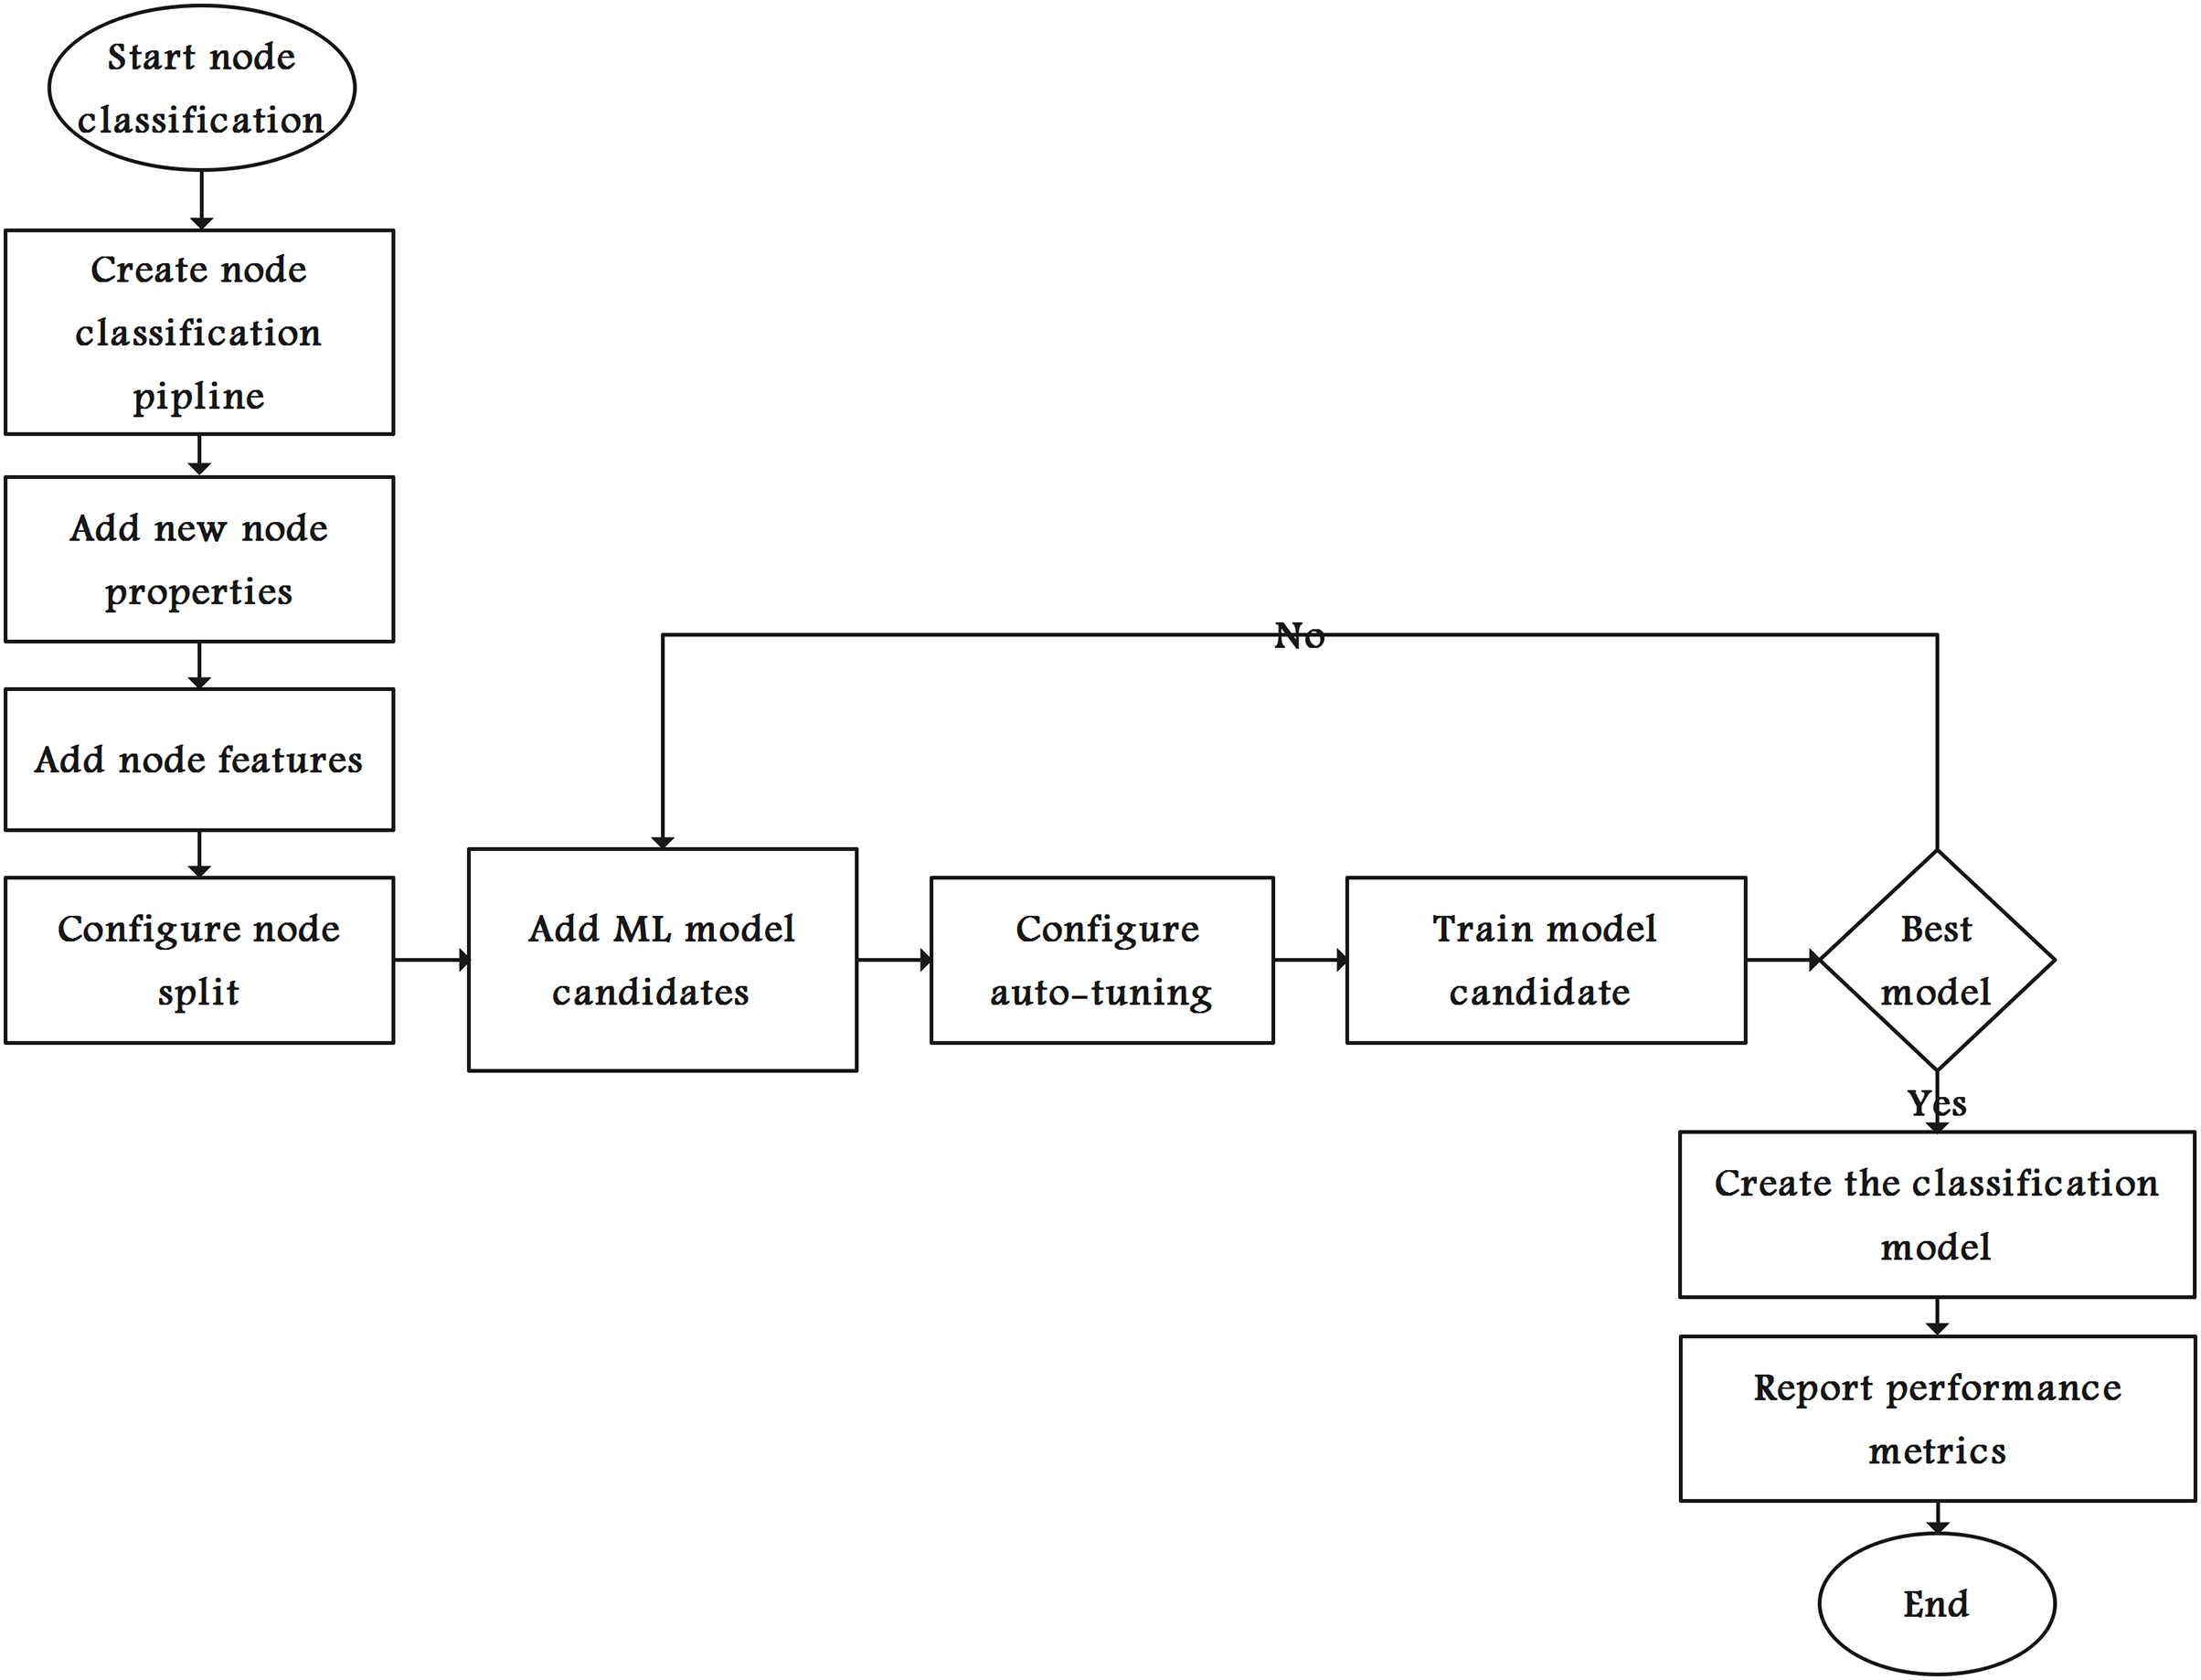
Figure 4 shows the steps in selecting the ML model with best performance metrics. The graph algorithms create new node property (FastRP in our case). Then, all or a subset of the node properties are used as features. Therefore, the nodes are split into several sets for training, testing, and validating the models. The node-splitting process starts by dividing the graph into two parts: training and testing.
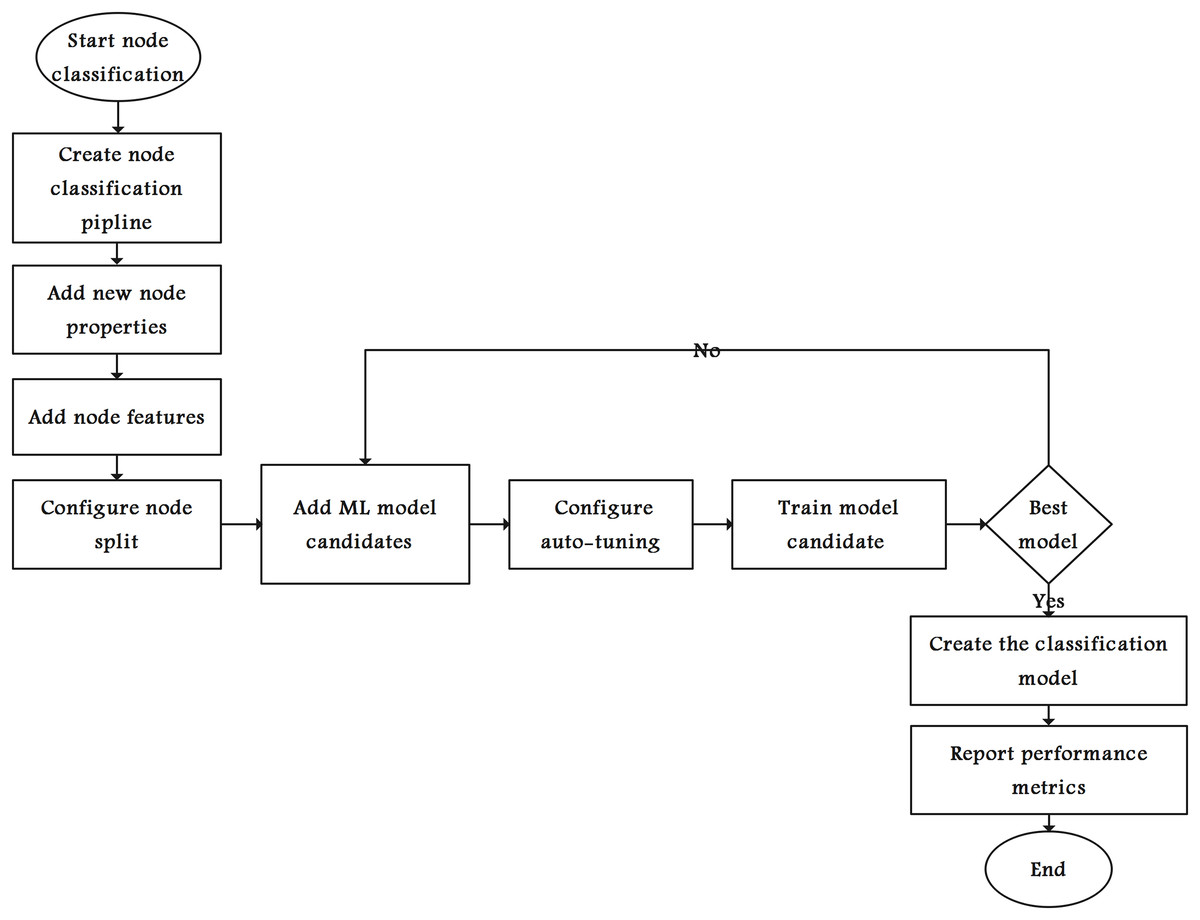
Figure 4: Flowchart of the node classification model.
Furthermore, we divide the training graph into several validation folds (this study used a stratified 10-fold cross-validation), each comprising a training set and a validation set. Each candidate was trained and validated until the best classification model was achieved, and relevant performance metrics were reported. Finally, the selected classification model was used to classify unlabeled nodes.
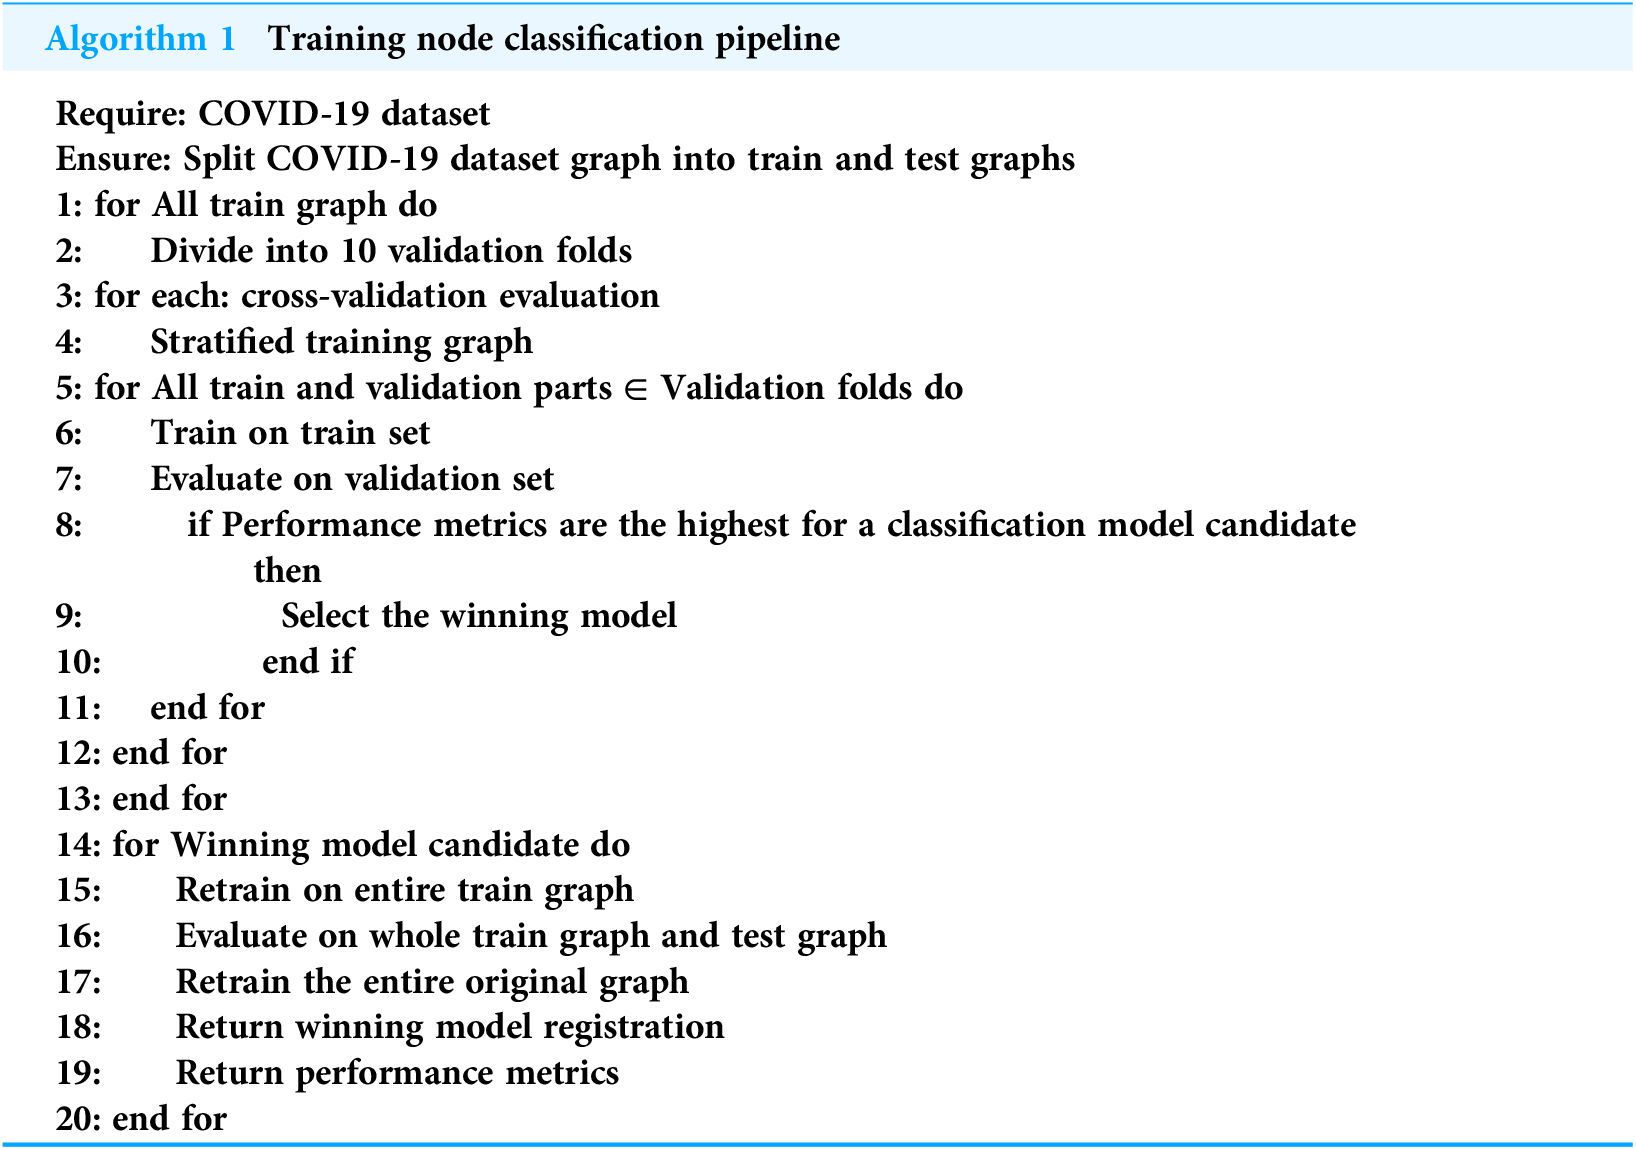
We compared the LR and RF models. Each model has several hyperparameters that were set to influence the training set in detecting COVID-19 infection. Algorithm 1 shows the node classification pipeline in the training process applied to both the LR and RF models.
|
Require: COVID-19 dataset Ensure: Split COVID-19 dataset graph into train and test graphs 1: for All train graph do 2: Divide into 10 validation folds 3: for each: cross-validation evaluation 4: Stratified training graph 5: for All train and validation parts ∈ Validation folds do 6: Train on train set 7: Evaluate on validation set 8: if Performance metrics are the highest for a classification model candidate then 9: Select the winning model 10: end if 11: end for 12: end for 13: end for 14: for Winning model candidate do 15: Retrain on entire train graph 16: Evaluate on whole train graph and test graph 17: Retrain the entire original graph 18: Return winning model registration 19: Return performance metrics 20: end for |
Logistic regression (LR) model
LR is a fundamentally supervised ML method that trains a model by minimizing a loss function depending on the training data and the weight matrix. In GDS, a gradient descent algorithm called the Adam optimizer was used to minimize the loss and update the parameters. Additionally, L2 regularization was used to avoid overfitting by adding the sum of the squared parameters or weights of a model (multiplied by some coefficient) into the loss function as a penalty term to be minimized.
LR uses a logistic function called a sigmoid function (activation function), defined as
(2) where e is the base of the natural logarithm. Equation (3) represents the LR model to obtain the predicted output y for the input value x. Here, b0 is the intercept, and b1 is the coefficient for x.
(3)
Random forest (RF) model
RF is a popular supervised ML method that combines several predictors called ensemble learning. It comprises several decision trees that are trained independently on a slightly different part of the training set for each predictor, often referred to as bootstrap aggregation or bagging. These decision trees in turn are combined to produce an overall prediction, which is the majority vote for the decision trees. Moreover, when only training a single decision tree on the entire training set, training each decision tree differently avoids overfitting. Equation (4) represents classification using the RF model.
(4)
Equation (4) begins by drawing a bootstrap sample from the training data. Then, Tb (a RF tree) is applied to the bootstrapped data. Random variables are selected for each ending node in the tree. Subsequently, the best variable splitting is chosen, and the node is split into two. These steps are repeated for each terminal node in the tree until the minimum node size is reached. Finally, the ensemble of trees and the predicted class of the RF tree are output.
Evaluation of the proposed classification models
During model evaluation, other performance measures must be considered to determine the best model given that accuracy alone is not sufficient.
Performance criteria
Using a stratified 10-fold cross-validation, we compared the performance of the LR and RF algorithms for the training graph. Additionally, each algorithm was evaluated using the following criteria.
1. The model accuracy was measured by the proportion of correctly predicted instances over the total number of predictions. The accuracy calculates the ratio of correctly classified cases to the total number of predictions.
2. The weighted average F1 score is a useful metric that takes the weighted mean of all F1 scores per class and considers both precision (positive predictive value) and recall (sensitivity).
Moreover, other statistical measures were used to evaluate the prediction results of the testing graph. These measures are explained in detail in “Results and discussion”.
Configuring automatic tuning of LR hyperparameters
Configuring the automatic tuning of LR model hyperparameters includes tolerance (minimal improvement of the loss to be productive) and patience (maximum number of unproductive consecutive iterations, generally in the range of 1–3). Additionally, the batch size is the number of nodes per batch, and the learning rate determines how rapidly the parameters are updated. Because we used L2 regularization, we added an L2 penalty equal to the square of the magnitude of the coefficients (Zhu, Tan & Cheang, 2017).
In general, higher values for patience and lower values for tolerance produce a high-quality model but with long training. However, to limit the computational cost, these values should be restricted to serve the purpose of regularization and mitigate overfitting.
Configuring automatic tuning of RF hyperparameters
In RF, GDS allows us to tune several hyperparameters to balance speed with memory consumption of the training and bias vs. the variance of the model. Furthermore, the criterion used for evaluating node splits during decision tree training is either Gini or entropy. The RF hyperparameters are as follows:
Number of decision trees in the RF model: A small number of decision trees leads to overfitting, whereas many trees increase the training time and memory consumption.
Maximum feature ratio: A set of features of the feature vectors for each node split in a decision tree. The number of feature vectors is the total number of features multiplied by the maximum feature ratio. However, a subset of all features (without replacement) is sampled when the number of feature vectors is smaller than the total number of features.
Minimum split size: This parameter determines the minimum number of training samples in a decision tree node and allows node splitting during training by adding more branches to the node. However, a high value of this parameter leads to poor performance.
Maximum depth: This parameter specifies the maximum depth of decision trees in the RF model. If high, there will be more node splits. and the training task will take a longer time, resulting in a high memory footprint.
Number of samples ratio: A subset of the training set in the RF is sampled with a replacement several times for each decision tree. The number of training samples for each decision tree is calculated by multiplying the total number of samples in the training set by the number of samples. Moreover, the sample ratio should be high for each decision tree to ensure a better generalization of the model. A value of 0 indicated that there was no sampling.
Results and discussion
Using the node classification pipeline described in “COVID-19 detection using ML pipelines”, the LR and RF models were trained on 5,434 nodes (COVID-19 dataset instances) with a hold-out method to split the entire COVID-19 dataset graph into training and test subgraphs. The test and training fractions were 0.2 and 0.8, respectively. Additionally, stratified 10-fold cross-validation was applied only to the training graph. Moreover, the training starts with the node properties, which are the dataset features discussed in Table 3, and the embedding features extracted through the aforementioned FastRP algorithm were added. In this case, we solved the target property by determining the class of the patient, whether or not they are infected with COVID-19. The created pipeline contains the configuration for each model candidate, which is called the model parameter space. The proposed method involves the application of automatic tuning to both ML models during training to select the best candidate and the best values for its hyperparameters. Table 4 presents the best hyperparameter-tuning configuration used for the LR and RF models and their values in this study. The best penalty values, patience, batch size, tolerance, learning rate, and optimizer used for the LR model are summarized. Additionally, it shows the best values of maximum depth, criterion, minimum leaf size, number of decision trees, minimum split size, and number of sample ratio hyperparameters of the RF model. The LR model achieved an accuracy of 98% and a weighted average F1-score of 0.897 for average training. Conversely, the RF model achieved the highest accuracy result of 99% and the highest weighted average F1-score of 0.998 for average training. Table 5 summarizes these scores.
| ML model | Hyperparameter values |
|---|---|
| LR model | Penalty:0.0, Patience:1, Batch size:100, Tolerance:0.001, Optimizer: Adam, Learning rate:0.001 |
| RF model | Criterion: Gini, Max depth:2147483647, Min leaf size:1, Decision trees:10, Min split size:2, Samples Ratio:1.0, Max features ratio:1.0 |
| ML model | Accuracy | Weighted average F1-score |
|---|---|---|
| LR model | 98% | 0.897 |
| RF model | 99% | 0.998 |
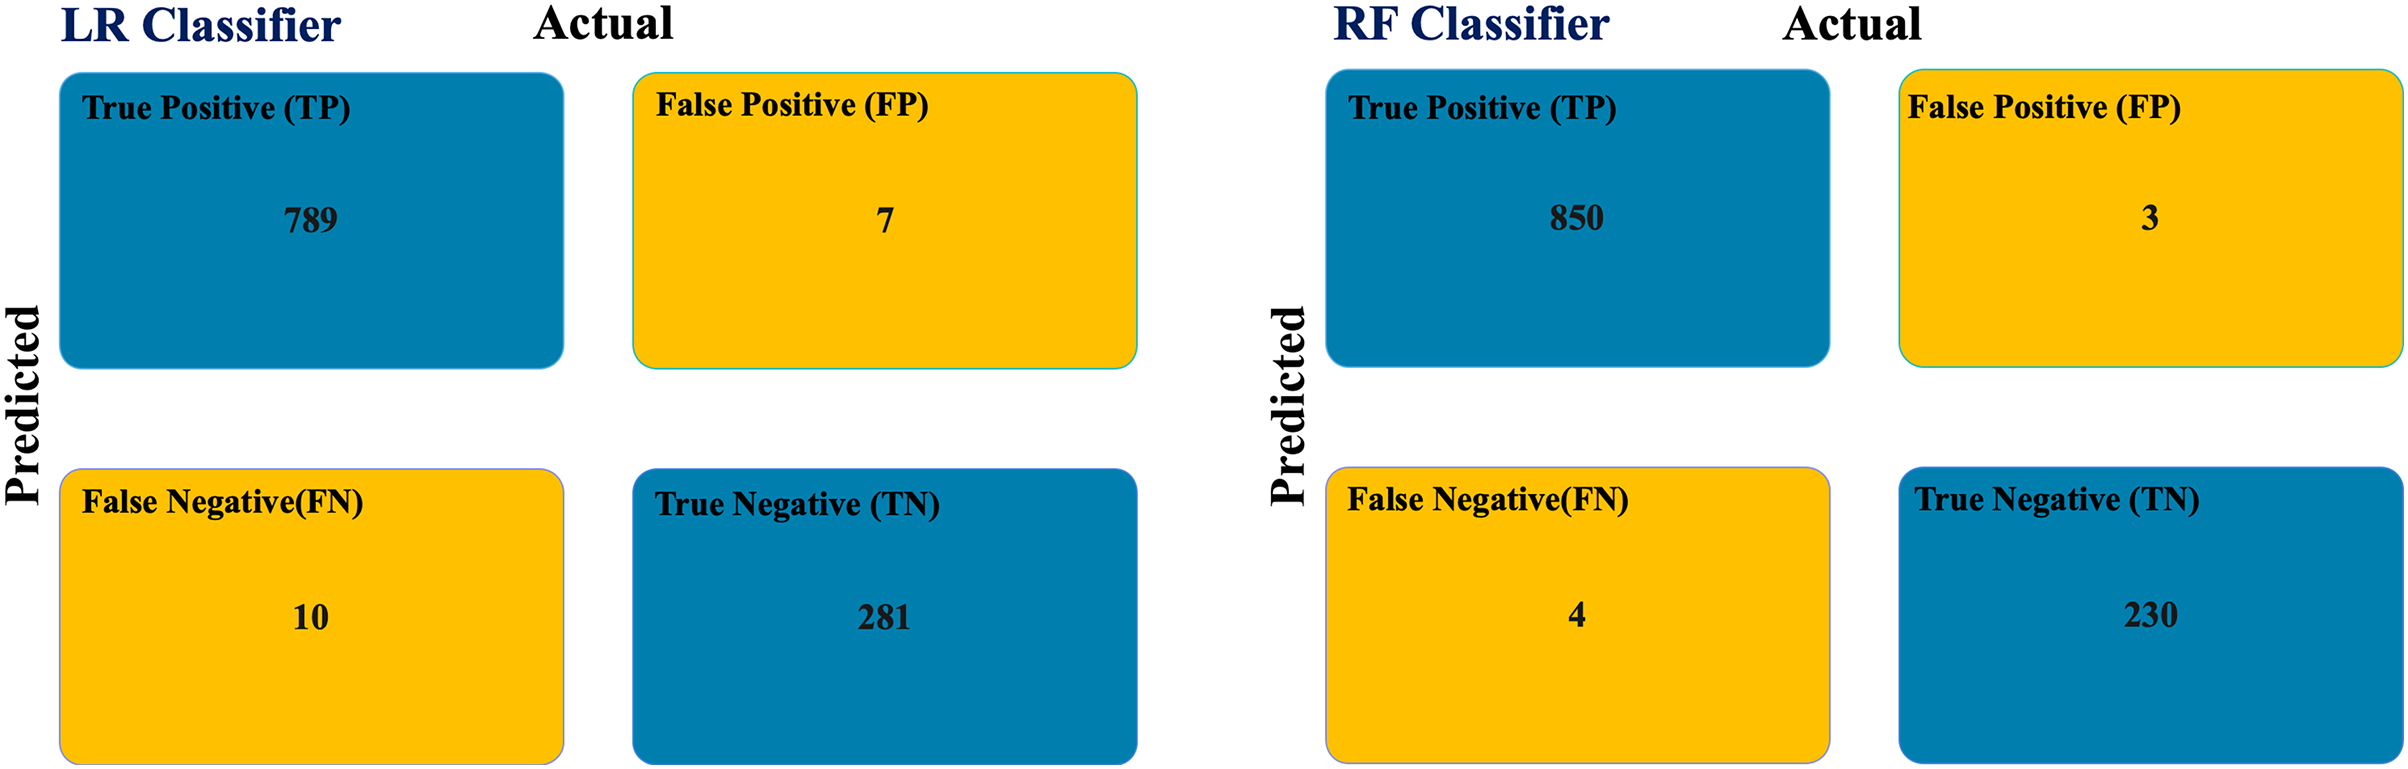
We applied the trained LR and RF models for predicting COVID-19 infection to predict the class of unclassified patient nodes in the COVID-19 dataset testing graph. Figure 5 shows the confusion matrix of the testing graph. In the graph-based RF model, there is a total of seven misclassified samples. But there are 17 misclassified samples in the graph-based LR model.
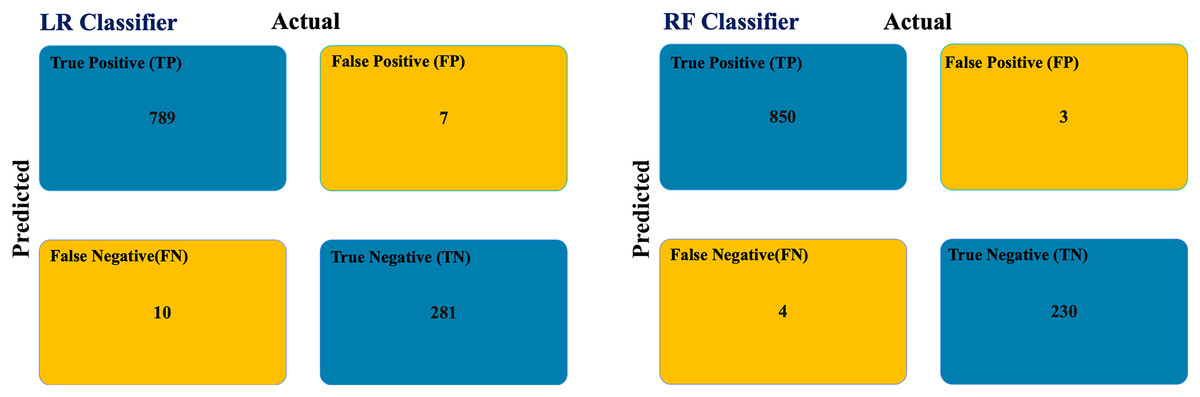
Figure 5: COVID-19 testing graph confusion matrix.
Table 6 summarizes the statistical measures for the COVID-19 dataset based on the confusion matrixes for the RF and LR classifiers. The graph-based RF model outperforms the graph-based LR model in all performance metrics. Additionally, latency was completed after 5,309 ms.
| Measure | LR | RF | Formula |
|---|---|---|---|
| Recall | 0.9875 | 0.9953 | |
| Specificity | 0.9757 | 0.9871 | |
| Precision | 0.9912 | 0.9965 | |
| Negative predictive value | 0.9656 | 0.9829 | |
| False positive rate | 0.0243 | 0.0129 | |
| False discovery rate | 0.0088 | 0.0035 | |
| False negative rate | 0.0125 | 0.0047 | |
| Accuracy | 0.9844 | 0.9936 | |
| F1 score | 0.9893 | 0.9959 | |
| Matthews correlation coefficient | 0.9600 | 0.9809 | |
| Error rate | 0.0156 | 0.0064 |
Matthews correlation coefficient is a robust metric that measures the difference between the actual and predicted values. It returned a high score of approximately one in our study, which confirmed that our RF classifier is effective when the testing graph is unbalanced. Based on these results, the graph-based RF model dominates the graph-based LR model in classifying COVID-19 infections from symptoms.
Abdul Salam, Taha & Ramadan (2021) proposed a federated ML for the detection of COVID-19. A comparison between federated and traditional ML models showed that the federated model had better accuracy with a high-performance time. Indeed, our proposed method achieved their results and had the following important characteristics:
Scalability: It is possible to add more nodes and graphs from different data sources using various techniques.
Sharding: Allows large graphs to be divided into several clusters or servers.
Federated graph: Creates a virtual graph that brings all the divided graphs together and supports queries from multiple graphs.
Agility: Multiple databases with the same or different schemas can run inside a single cluster and in the cloud.
Security: Support granular security that gives different schema views of the same graph.
Although many works have been created for COVID-19 detection from initial symptoms, this study makes it possible to create auto-tuning ML pipeline that assists an accurate prediction and enhances the KG. The main issue in our study is in selecting the appropriate graph algorithm to extract additional features for enhancing the detection accuracy.
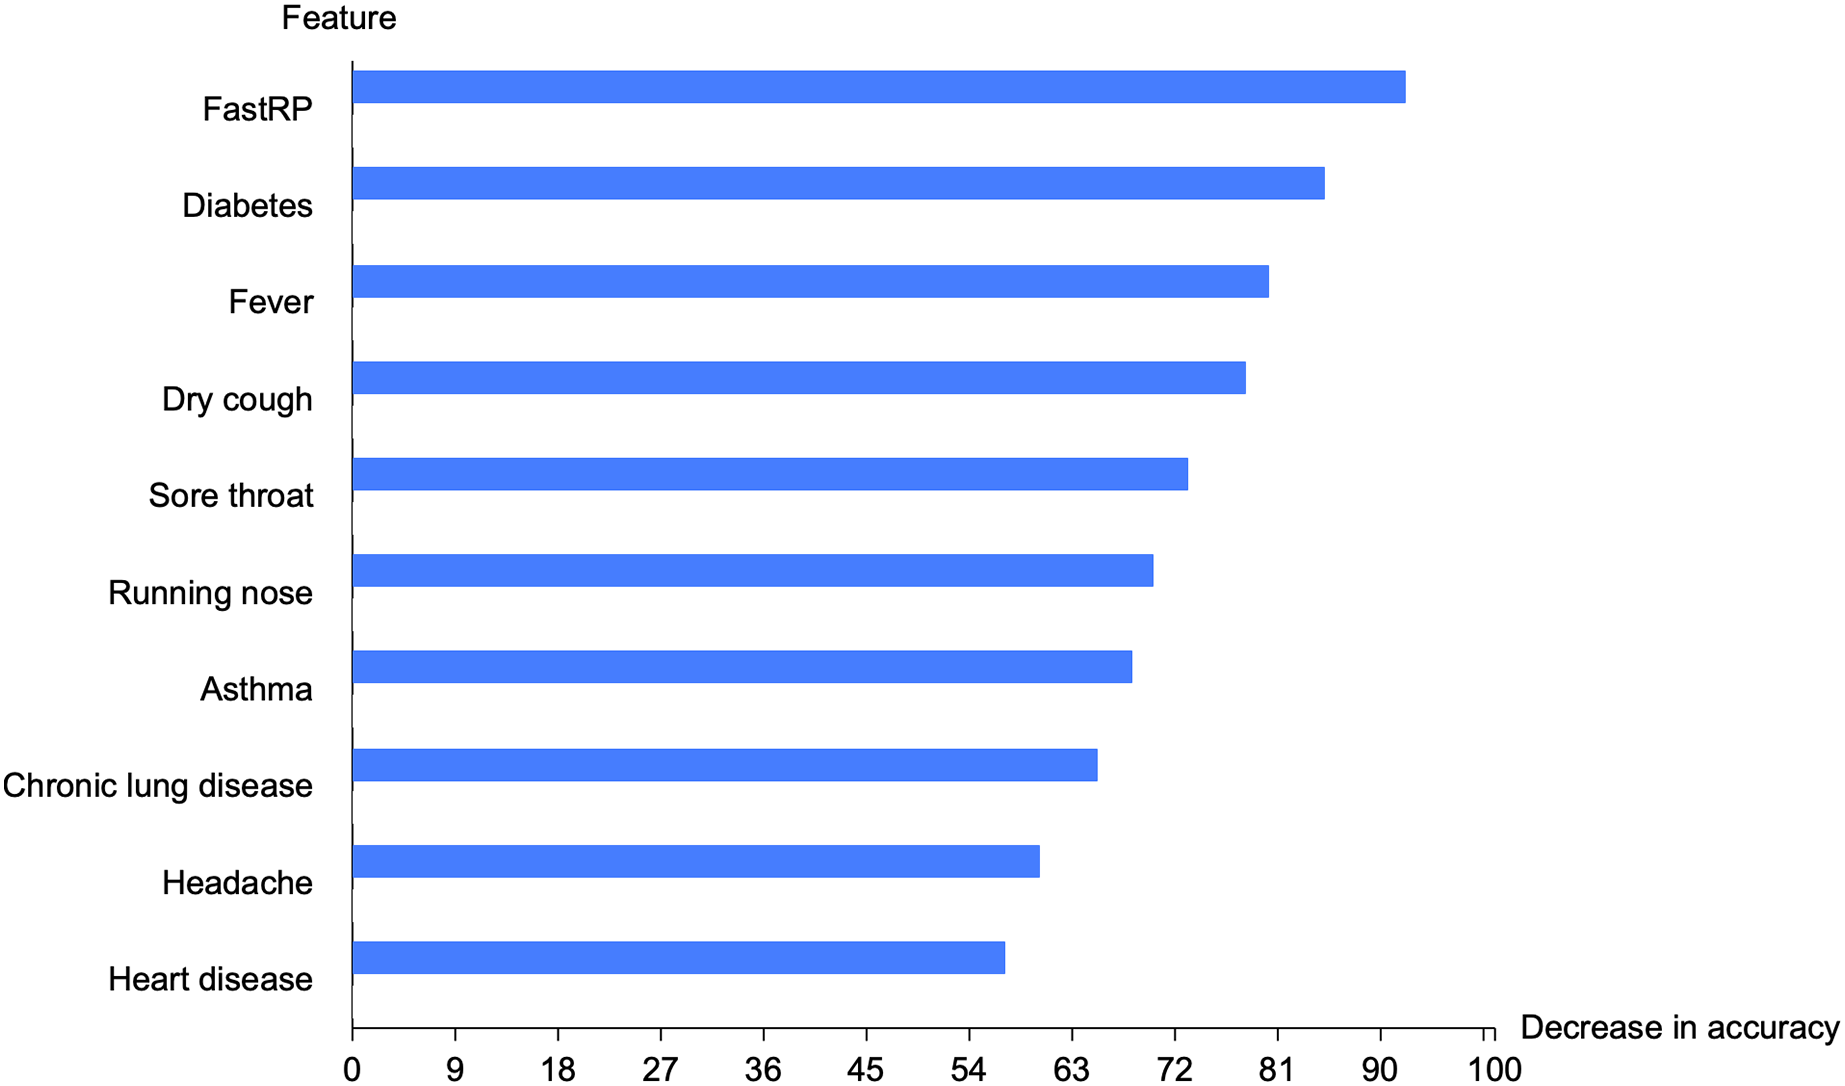
We implemented the feature permutation importance that tells us which features the model relies on the most. Figure 6 depicted the top 10 important features in the graph-based RF model. FastRP feature is the highest important feature, followed by diabetes, fever, dry cough, sore throat, running nose, asthma, chronic lung disease, headache, and heart disease. FastRP is the feature that offers a valuable information to our model, and removing this feature will lead to a decrease in the accuracy of the proposed model.
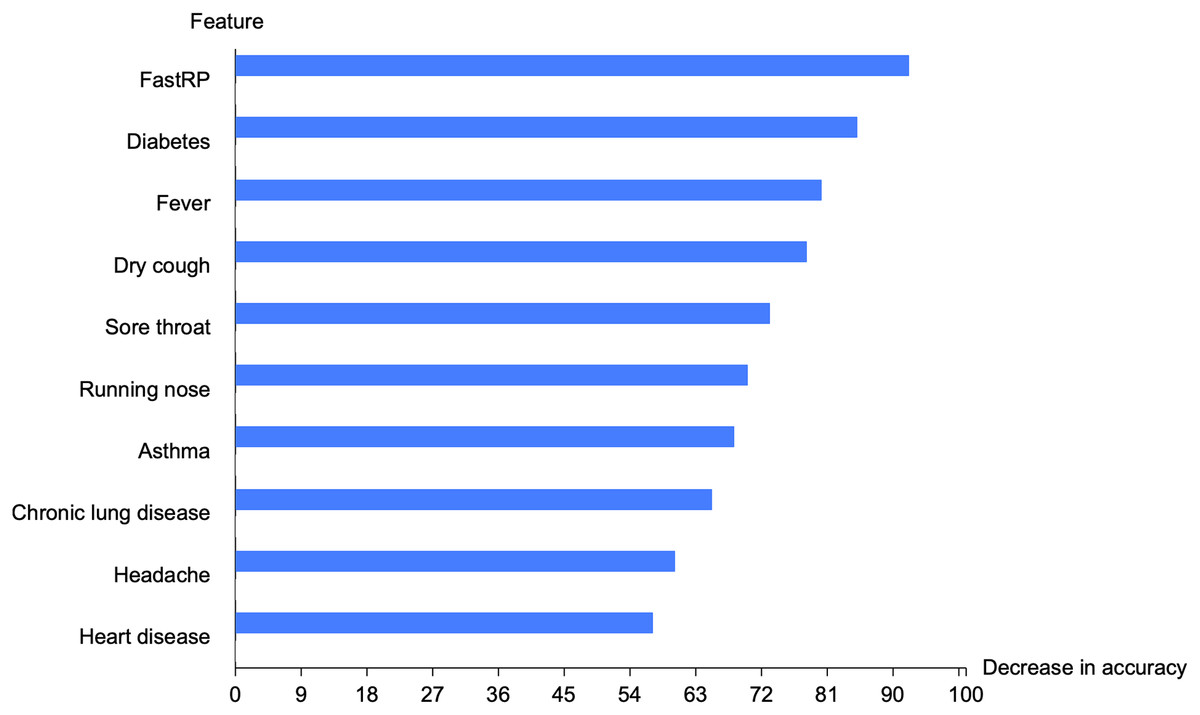
Figure 6: Top 10 important features in the proposed model.
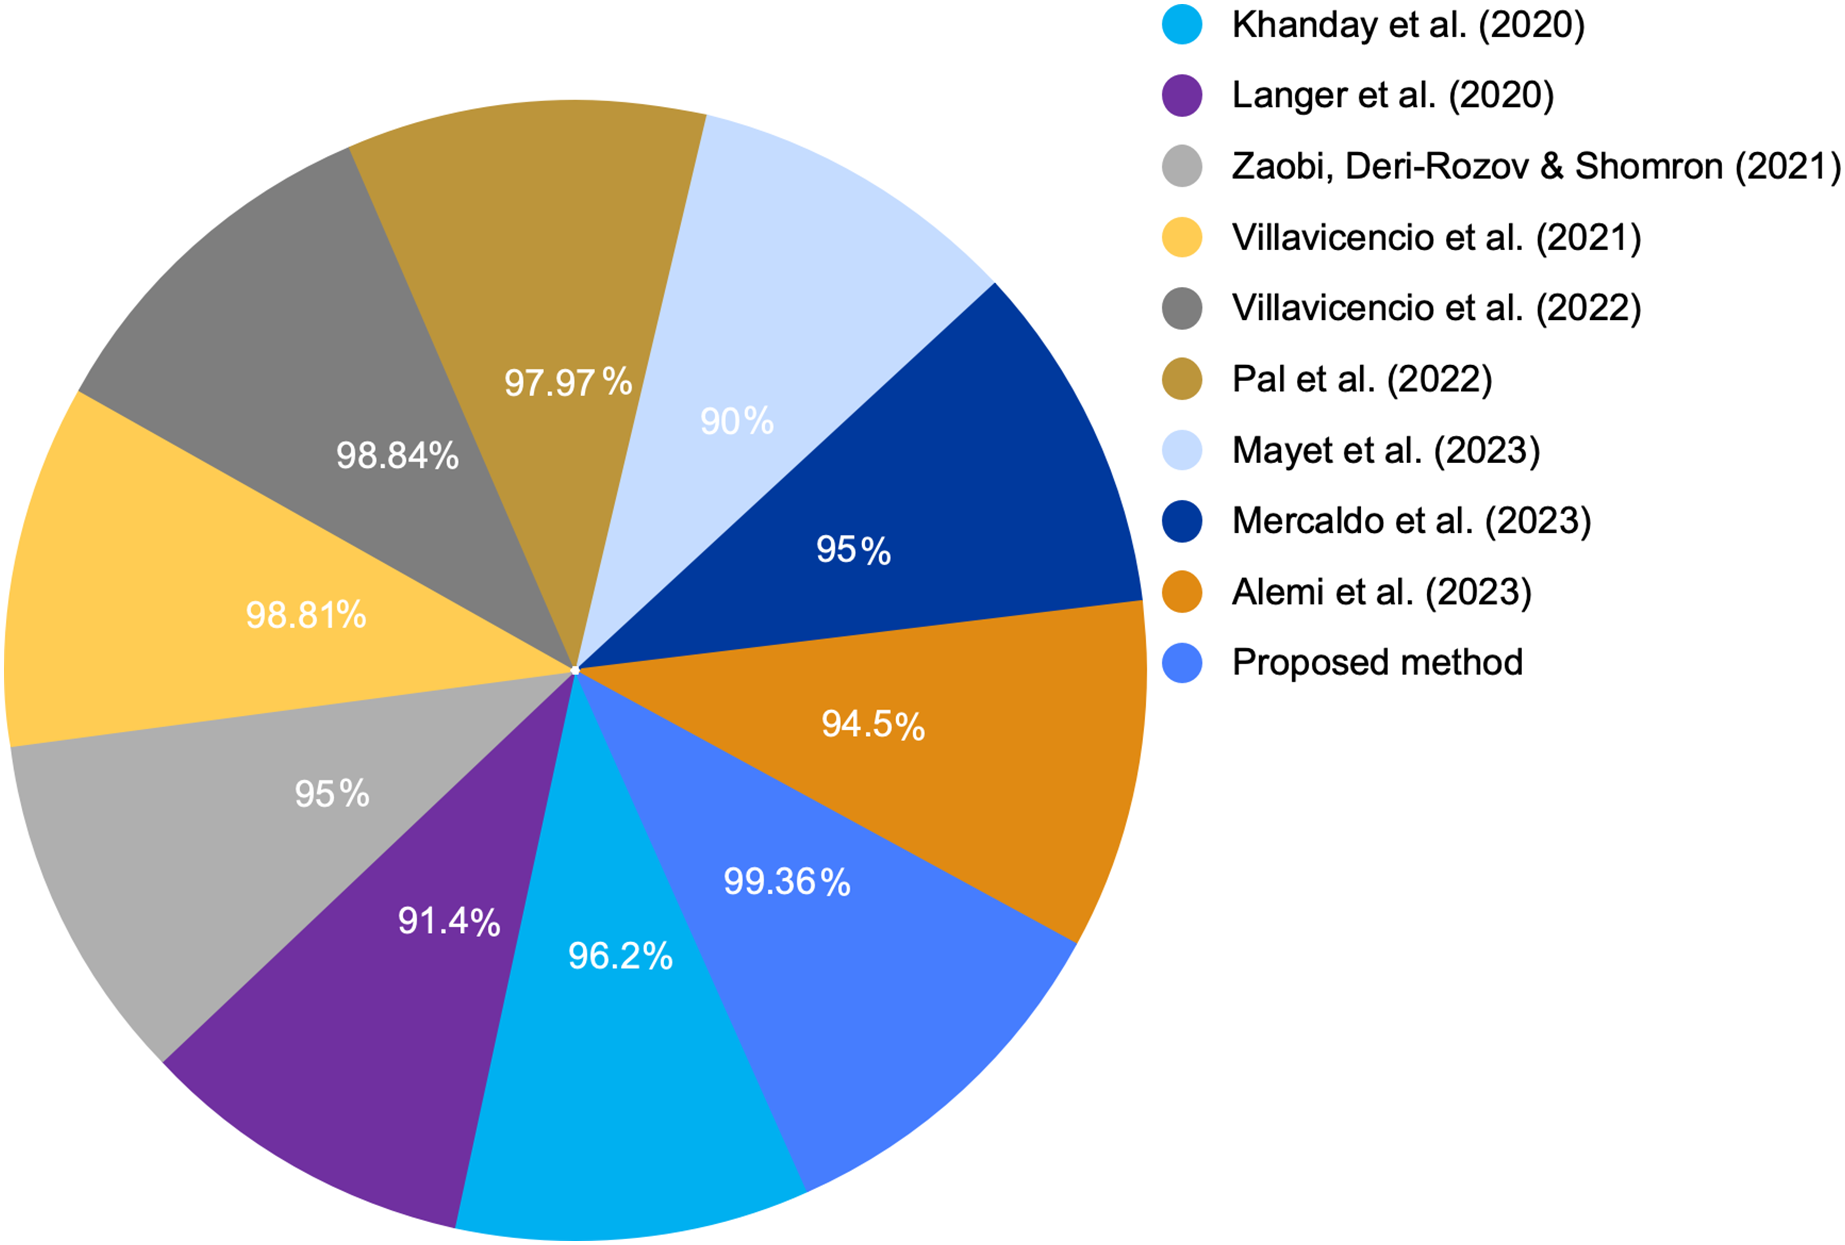
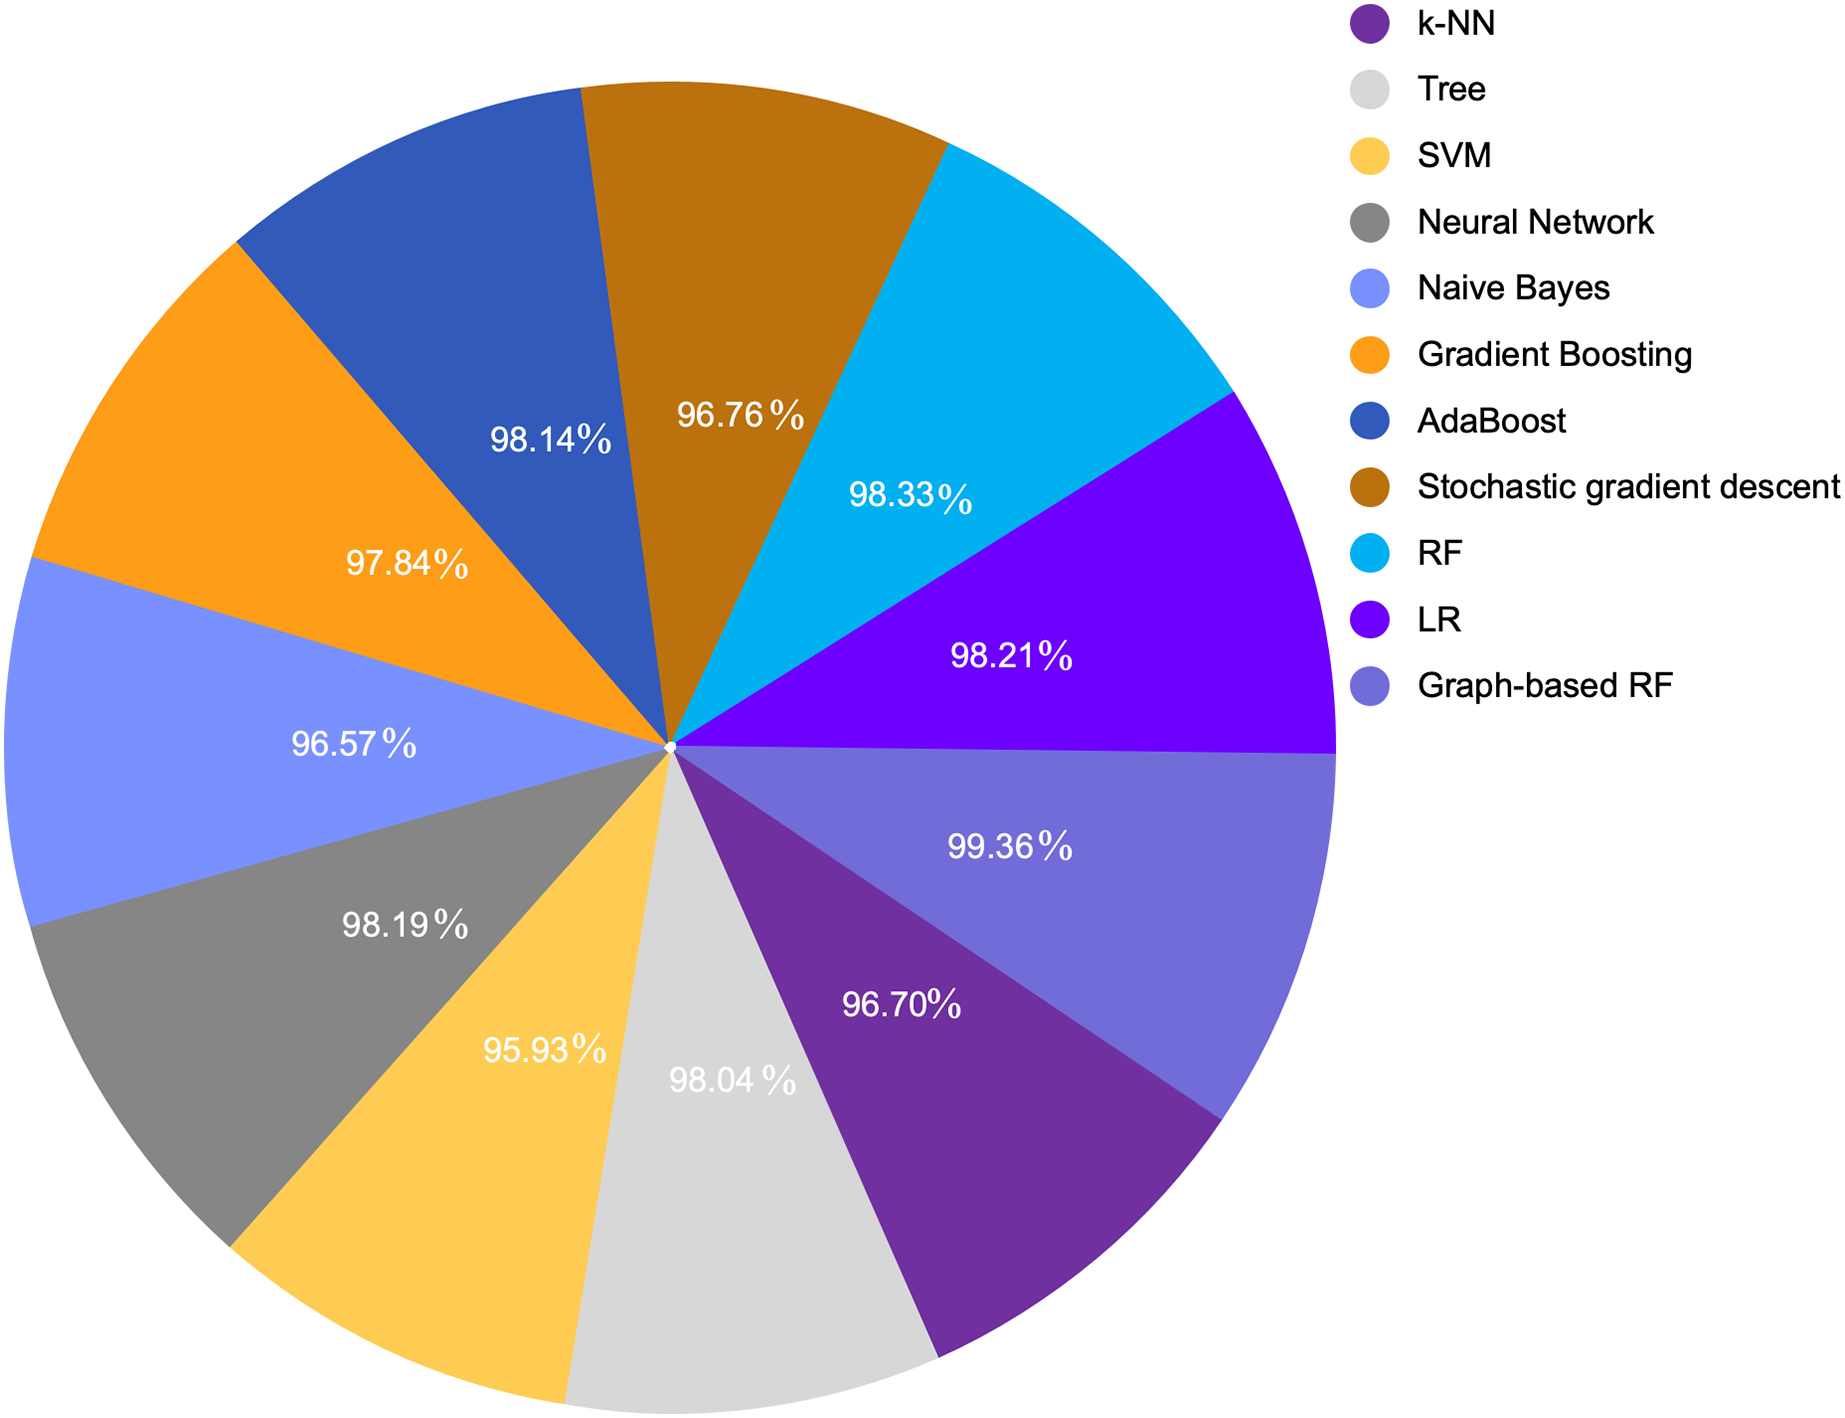
Table 7 provides a comparison between the proposed model with the extracted feature and various ML algorithm. We compared various ML algorithms with different accuracies for the same dataset with original features and default settings. Because LR and RF provided the highest performance metrics including accuracy, precision, recall, and F1-score among all other models, we selected them to enhance their performance through GDS. Figures 7 and 8 show a graphical representation for different accuracies when compared with the proposed graph-based RF model. The graph-based model is superior to other ML algorithms.
| Model | Accuracy | F1 score | Precision | Recall |
|---|---|---|---|---|
| k-NN | 0.9670 | 0.9659 | 0.9679 | 0.9670 |
| Tree | 0.9804 | 0.9805 | 0.9807 | 0.9804 |
| SVM | 0.9593 | 0.9599 | 0.9615 | 0.9593 |
| Neural network | 0.9819 | 0.9820 | 0.9822 | 0.9819 |
| Naive bayes | 0.9657 | 0.9654 | 0.9653 | 0.9657 |
| Gradient boosting | 0.9784 | 0.9784 | 0.9784 | 0.9784 |
| AdaBoost | 0.9814 | 0.9815 | 0.9816 | 0.9814 |
| Stochastic gradient descent | 0.9676 | 0.9671 | 0.9672 | 0.9676 |
| RF | 0.9833 | 0.9847 | 0.9858 | 0.9836 |
| LR | 0.9821 | 0.9836 | 0.9826 | 0.9847 |
| Graph-based RF | 0.9936 | 0.9959 | 0.9965 | 0.9953 |
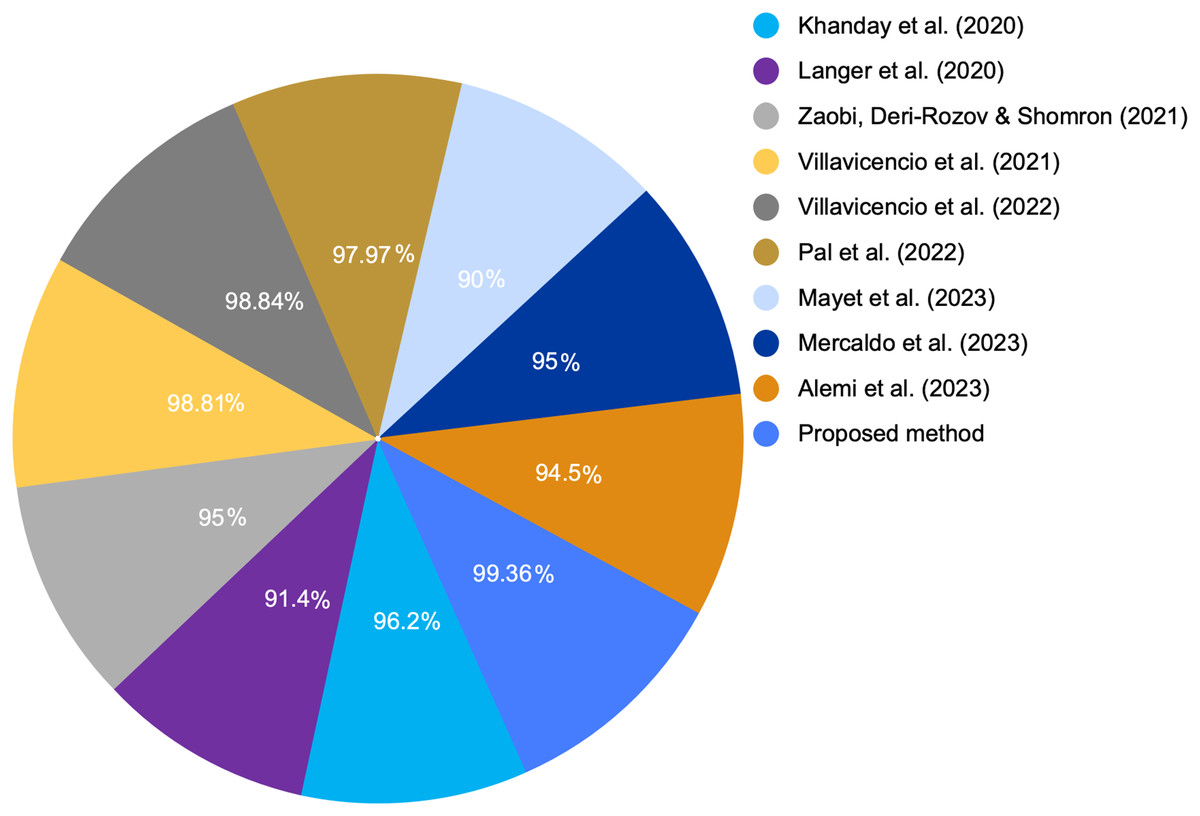
Figure 7: COVID-19 detection accuracy from various studies.
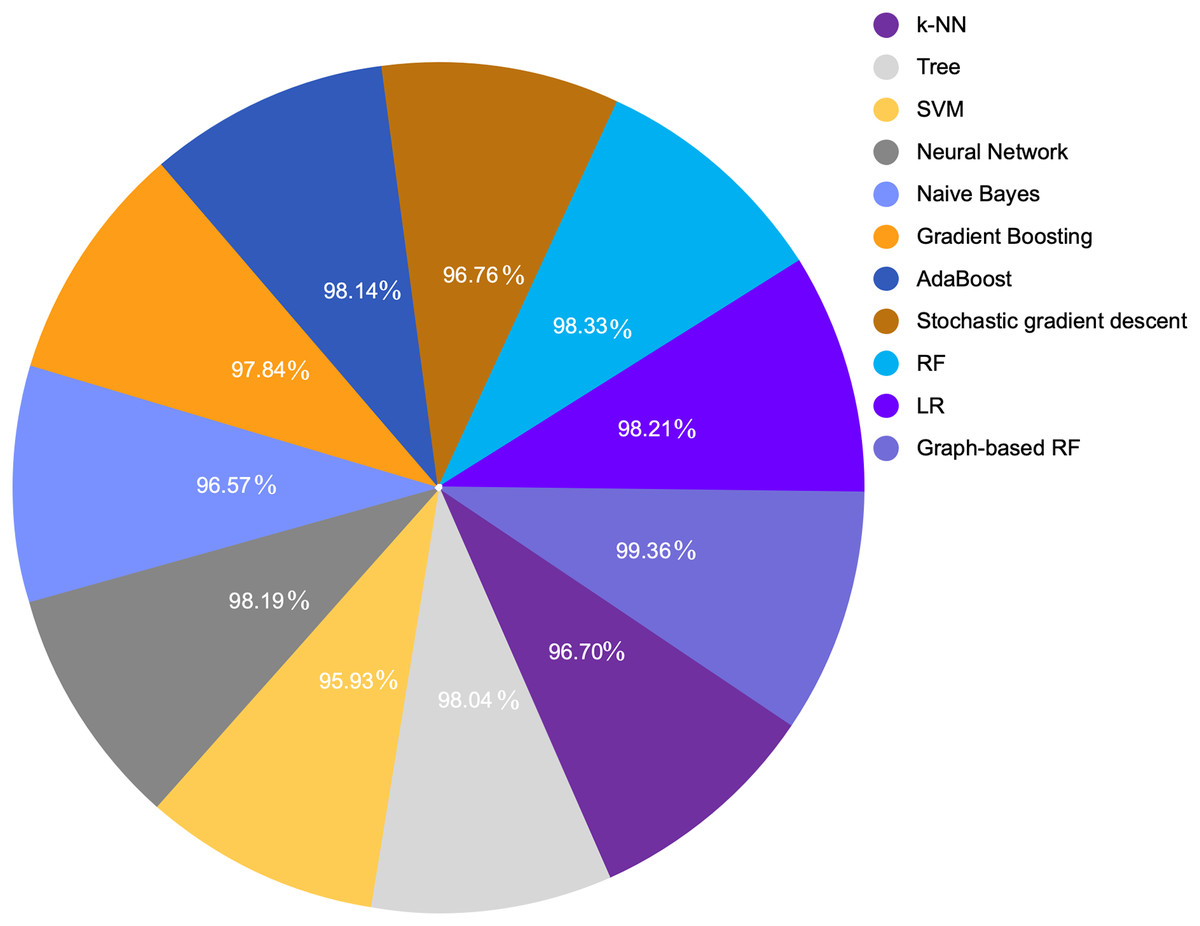
Figure 8: COVID-19 detection accuracy from symptoms in various ML algorithms.
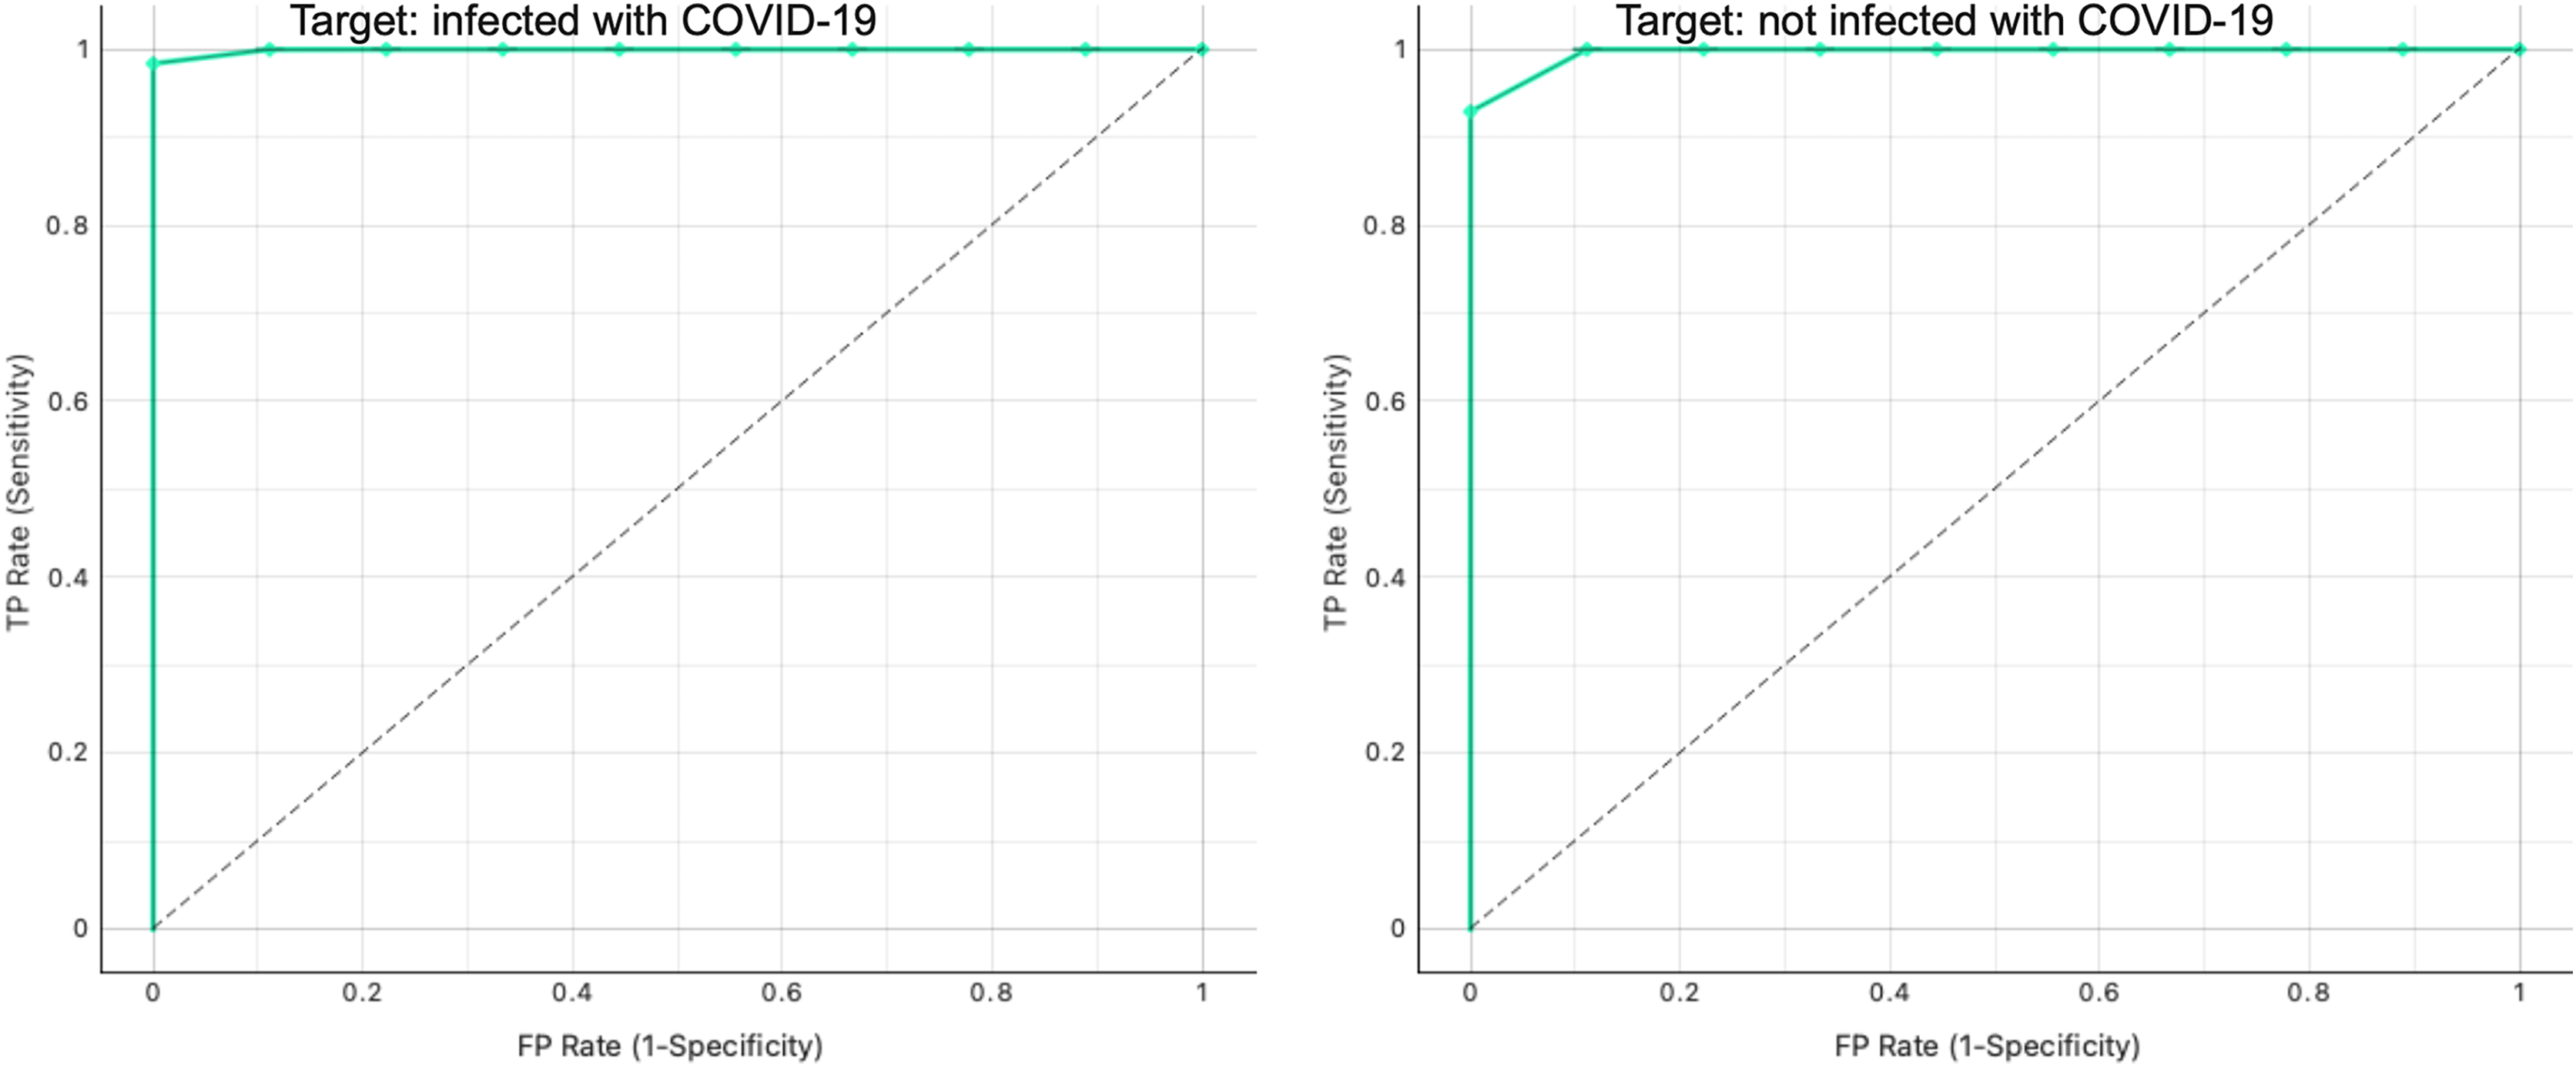
Additionally, Fig. 9 shows the ROC analysis results for the proposed graph-based RF model. We obtained a perfect model with AUC = 1 for the binary classification.

Figure 9: ROC curve analysis for infected and non-infected samples in the testing graph.
Conclusions
GDS is a powerful, innovative, and science-driven approach that enhances and accelerates data predictions. This study used the COVID-19 KG constructed from the literature. Additionally, HDO was added to the imported KG to visualize the COVID-19 relationships and to help declare pathogens, hosts, complications, and other valuable information regarding the COVID-19 infectious disease. Furthermore, we applied a graph-based ML model to predict COVID-19 infection from symptoms. As a result, the proposed graph-based RF model performed better than the graph-based LR model in terms of predicting positive or negative infections from the COVID-19 dataset. The proposed graph-based RF model outperformed other models that used the same dataset. However, further studies could apply different graph algorithms or other datasets. In the future, we plan to train a link prediction model to predict the relationships in the graph through graph algorithms such as community detection or centrality algorithms. Additionally, the entire graph can be used to provide more remarkable results to classify and predict different relations for other infectious diseases. Furthermore, natural language processing techniques can be applied to extract and import valuable data from clinical reports into the graph. Finally, this study showed that leveraging connections throughout COVID-19 KG by using a graph embedding algorithm is helpful for more accurate prediction. Moreover, it encourages more research using GDS and AI techniques to detect other infectious diseases and understand new and hidden relationships.