Antibiotic-induced population fluctuations and stochastic clearance of bacteria
- Emory University, United States
Figures
Figure 1 with 4 supplements
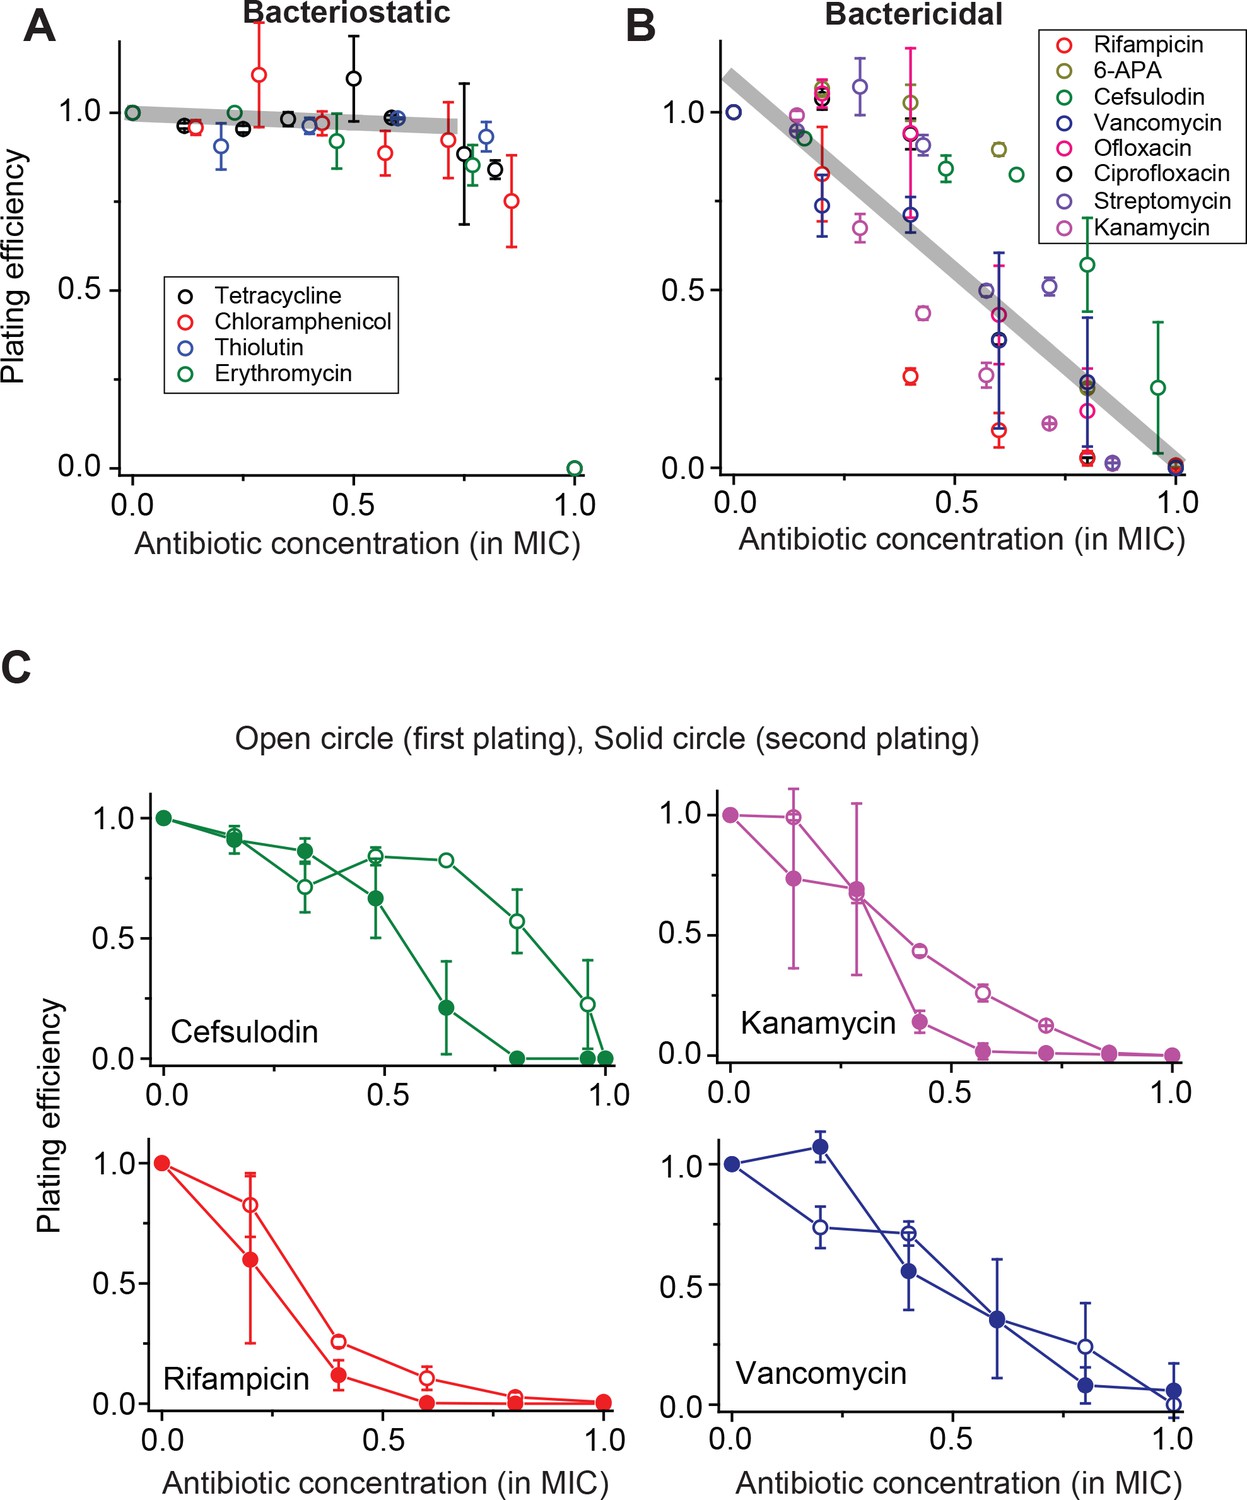
Contrasting trends in plating efficiency at increasing concentrations of bacteriostatic and bactericidal drugs.
(A) When we performed the plate assay using bacteriostatic drugs, NCFU was generally maintained at increasing drug concentrations. See Figure 1—figure supplement 1 for a detailed illustration of how this plot was made. A linear regression analysis was performed for the whole data set below 0.75 × MIC, resulting in the grey line (slope = −0.05, intercept = 0.9942, R-squared = 0.99). Colony size decreased at increasing drug concentrations (Figure 1—figure supplement 2). (B) For bactericidal drugs, NCFU decreased at increasing drug concentrations, indicating heterogeneous population dynamics of bacteria. A linear regression analysis was performed for the whole data set, and the result was plotted as a grey line (slope = −1.07, intercept = 1.10, R-squared = 0.79). For both groups of drugs, the lowest concentration yielding no colonies was defined as the MIC. The Supplementary File 1 lists the MICs for all drugs examined in this study. We plotted plating efficiency for each antibiotic in separate panels in Figure 1—figure supplement 4. (C) For each bactericidal drug used in the experiment (for which the results were shown in Figure 1B), we picked a few colonies from the agar plate exhibiting a plating efficiency of ~0.5 (e.g., near 0.6 × MIC) and plated them immediately on fresh agar plates containing various concentrations of the same drug. The plating efficiency was similar or marginally lower on the second plating, possibly because exposure to the antibiotics on the first plate adversely affected the cells and rendered them more susceptible to the antibiotics on the second plating. See Figure 1—figure supplement 3 for similar results for other drugs. Therefore, the ability of bacteria to grow and form colonies on plates containing bactericidal drugs was not heritable. We performed at least two biological repeats for all the experiments and plotted the mean here. The error bars represent one standard deviation from the repeats.
Figure 1—figure supplement 1
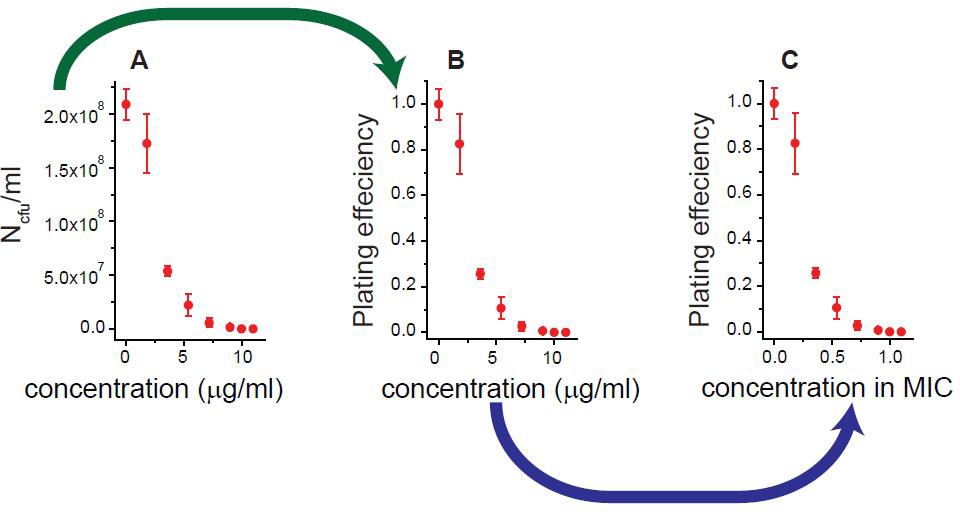
We illustrated how we obtained Figure 1A and B, using the results for rifampicin as an example.
Antibiotic-susceptible, wild-type E. coli cells were spread on agar plates containing increasing concentrations of rifampicin. After 18 hr of incubation, the number of colony forming units (NCFU) per milliliter was determined; see panel A. By normalizing NCFU to that for an antibiotic-free plate (N0CFU), we obtained the plating efficiency (=NCFU/N0CFU); see panel B. We defined the lowest drug concentration at which the plating efficiency was zero as the MIC: MIC = 10 µg/ml for rifampicin. We normalized the drug concentration to the MIC value; see panel C. We repeated this procedure for various antibiotics and plotted the results in Figure 1A and B.
Figure 1—figure supplement 2
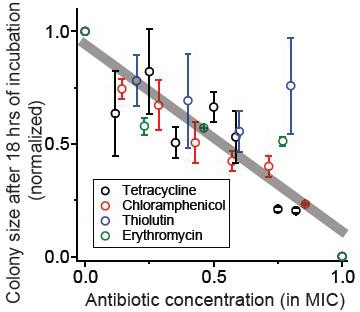
We spread cells on agar plates containing various concentrations of bacteriostatic drugs, and after 18 hr of incubation, measured the size of the colonies (using ImageJ software).
At increasing concentrations, the size of the colonies decreased. The figure shows the sizes of the colonies normalized to the size on the plate without antibiotics. We performed at least two biological repeats for all the experiments and the error bars represent one standard deviation from the repeats. The grey line was obtained from a linear regression analysis of the whole data set: slope = −0.83, intercept = 0.95, R-squared = 0.80.
Figure 1—figure supplement 3

For each bactericidal drug used (for which the results were shown in Figure 1B), we picked a few colonies from an agar plate exhibiting the plating efficiency of ~0.5 (e.g., near 0.6 × MIC) and plated them immediately on fresh agar plates containing various concentrations of the same drug.
The data for ciprofloxacin, 6-APA, streptomycin, and ofloxacin were reported here. (The data for cefsulodin, vancomycin, kanamycin, and rifampicin were reported in Figure 1C).
Figure 1—figure supplement 4
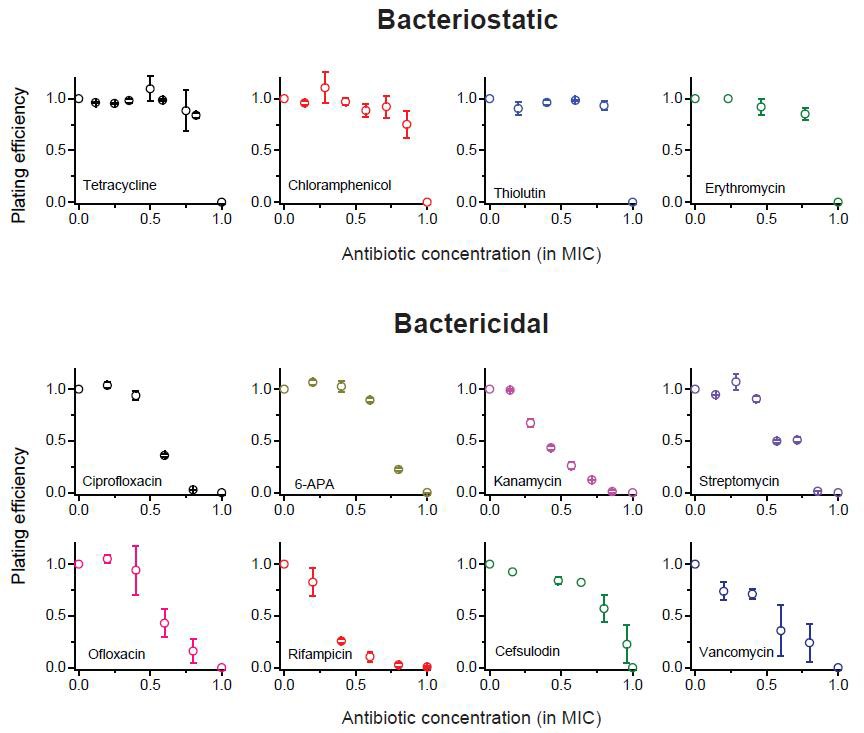
We previously plotted plating efficiency for all the antibiotics tested in two panels (Figure 1A–B).
Here, we plot it for each antibiotic in separate panels.
Figure 2 with 6 supplements
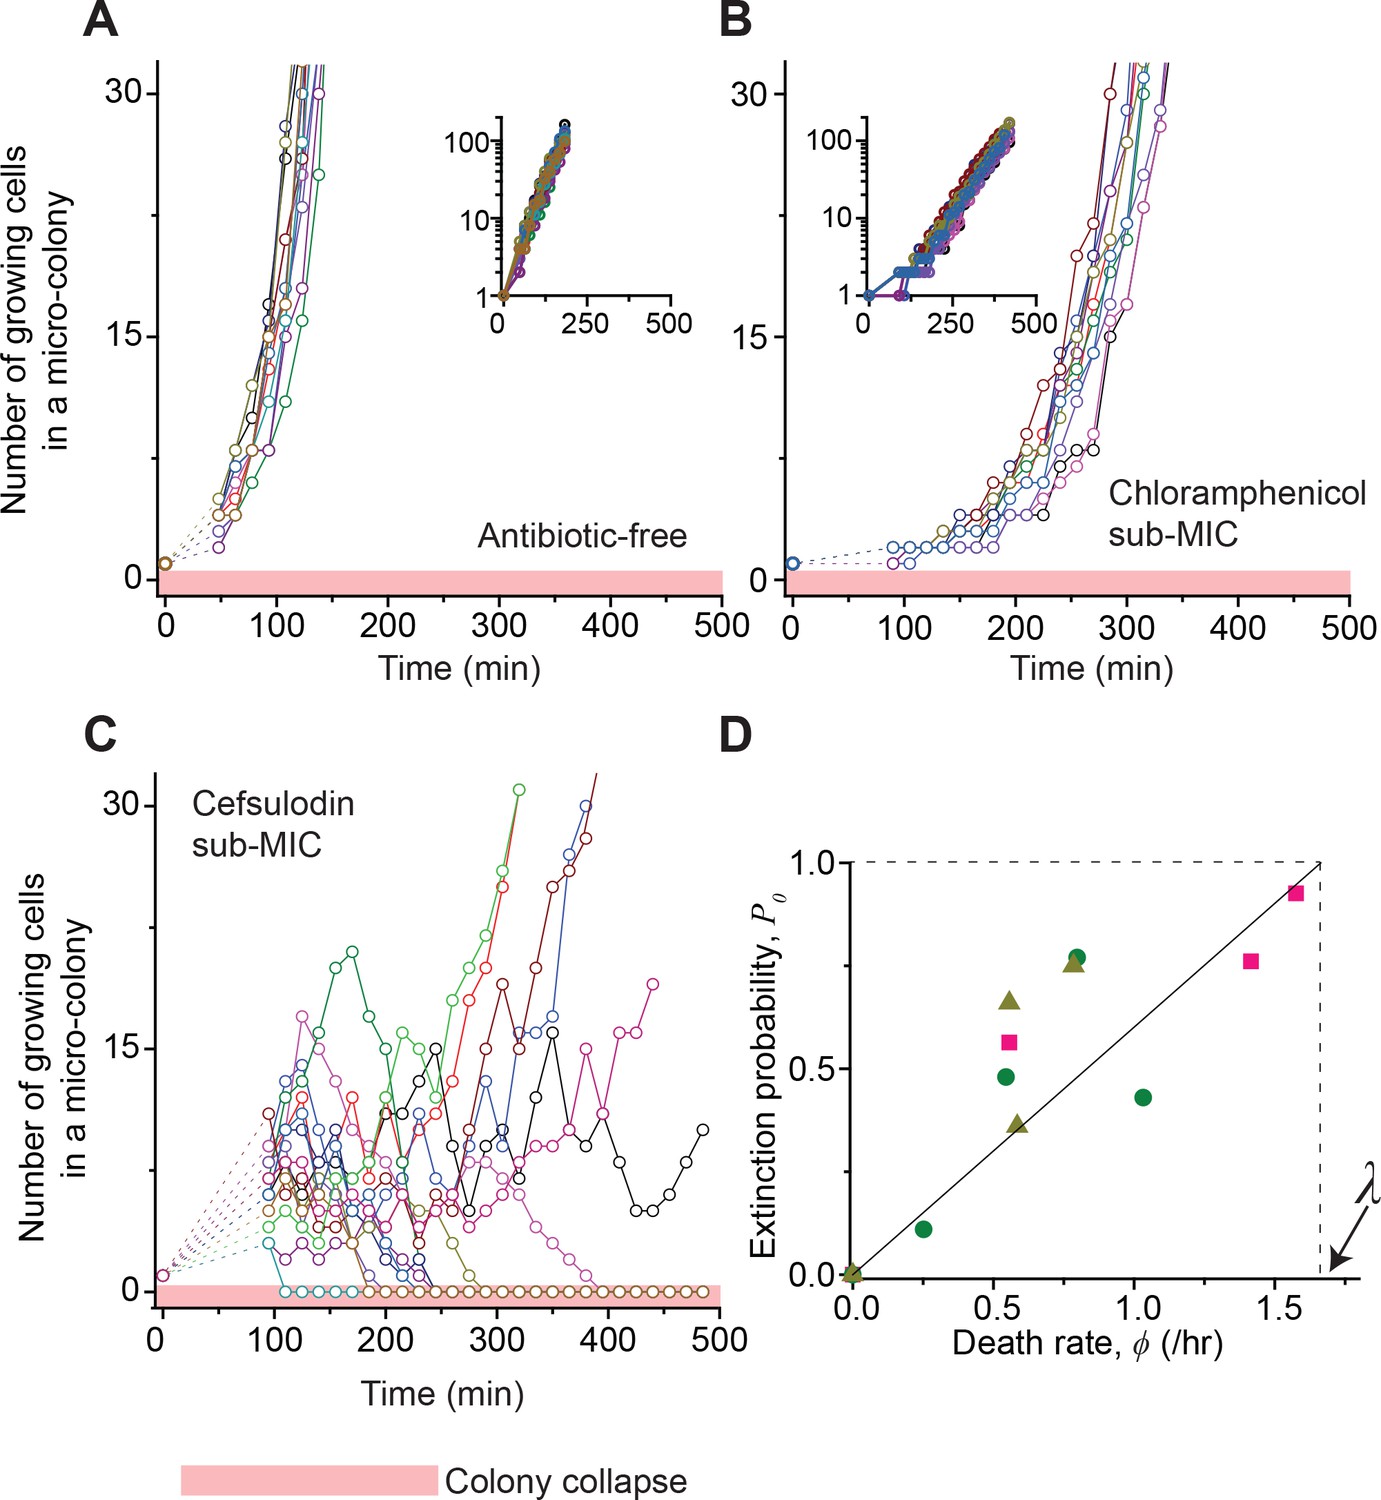
Stochastic population dynamics of bacteria exposed to bactericidal drugs.
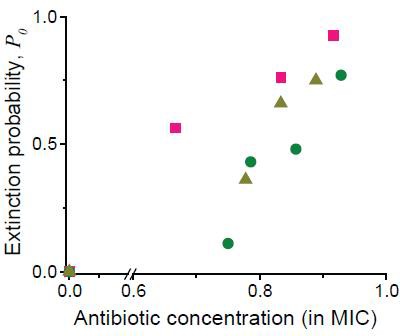
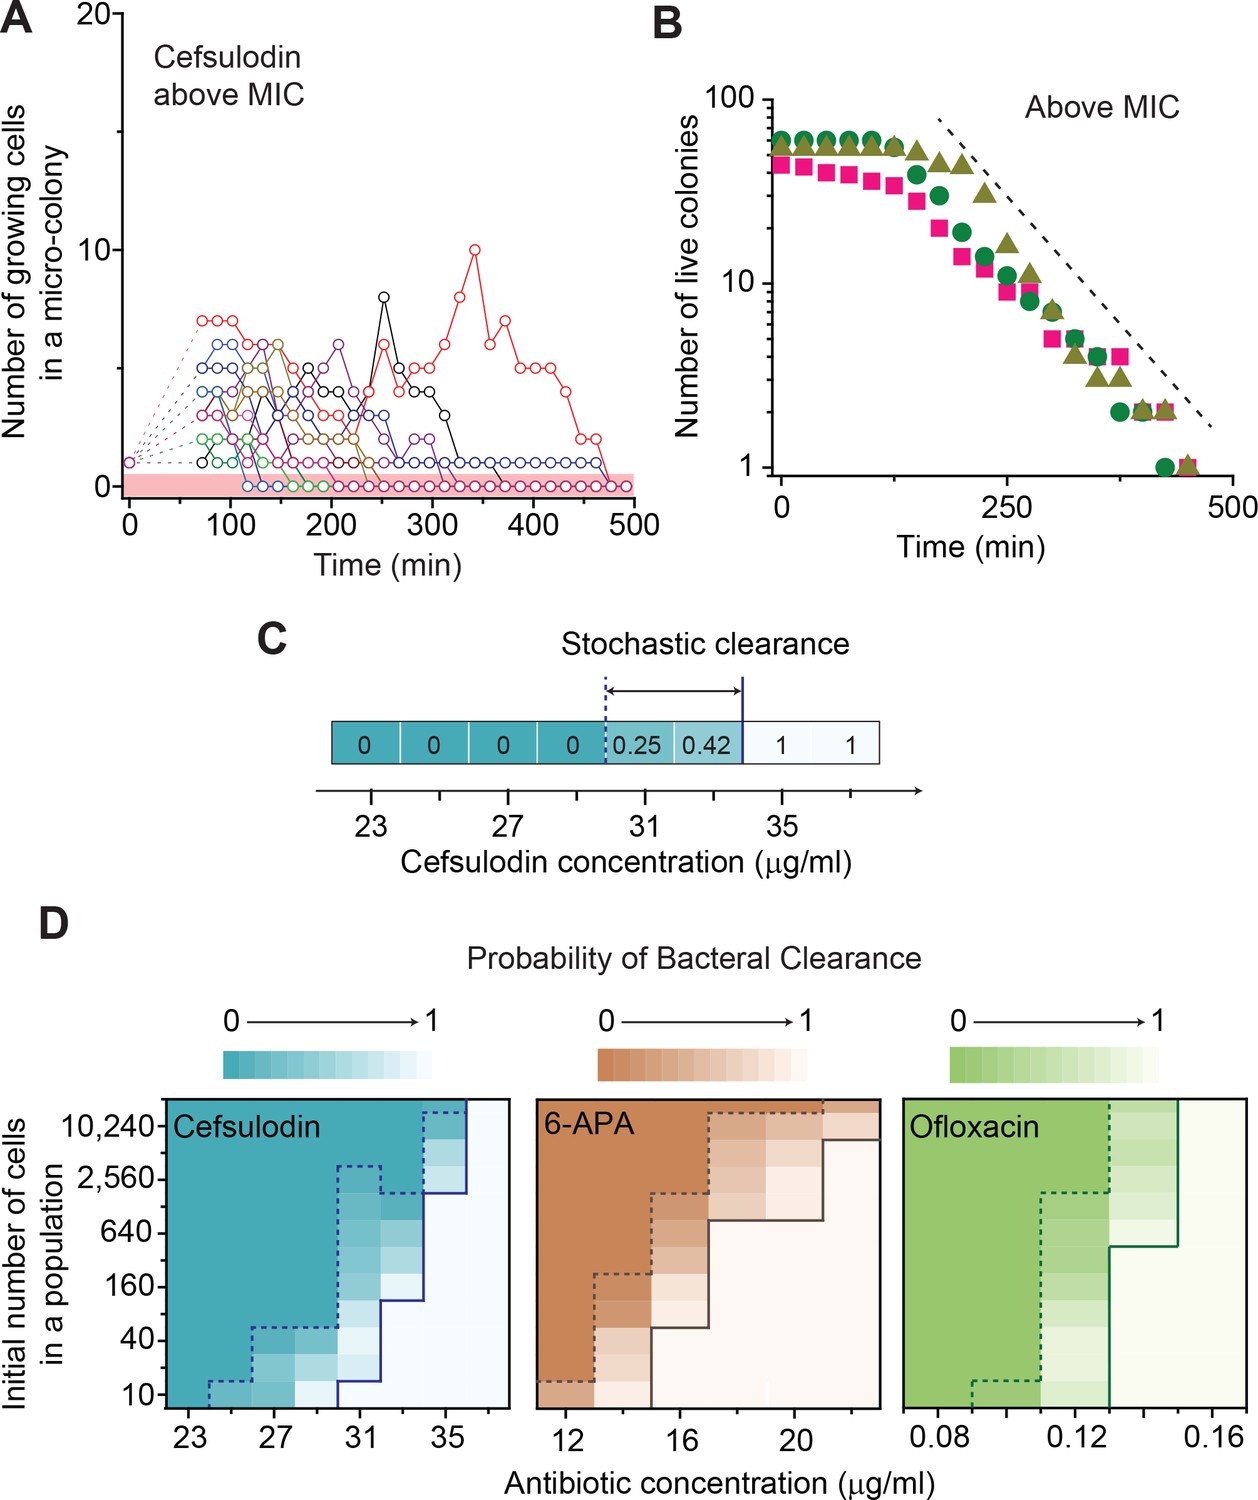
We characterized how cells grow and form micro-colonies on LB agar plates containing different concentrations of antibiotics using time-lapse microscopy. At time zero, we transferred cells growing in antibiotic-free LB liquid medium to a LB agar plate, and confirmed that individual cells were spread out and isolated. Setting up a time-lapse imaging experiment after the transfer took 1 ~ 2 hr, which is why there is a gap in the data immediately after time zero (dashed lines). The experiments were independently repeated twice (biological repeats) and the data from one experiment are shown here. (A, B) We counted the number of growing cells in each micro-colony (represented by a different color). In the absence of antibiotics (panel A) or with a sub-MIC level of a bacteriostatic drug (panel B, 0.7 × MIC of chloramphenicol), the number increased similarly for different colonies, revealing homogeneous population growth. Example image sequences are shown in Videos 1 and 2. The data are replotted on a semi-log scale (insets). Such homogeneous population growth was observed for other bacteriostatic drugs (thiolutin and tetracycline) as well; see Figure 2—figure supplement 1. When we repeated the experiment using a microfluidic device, we again observed the same homogeneous population dynamics (Figure 2—figure supplement 2A). (C) In contrast, the population dynamics of bacteria exposed to a bactericidal drug were highly heterogeneous. An example image sequence was shown in Video 3. The number of growing cells within micro-colonies at 0.8 × MIC of cefsulodin is plotted here; the result shows stochastic population fluctuations. Such population fluctuations were again observed when experiments were repeated using other bactericidal drugs (ofloxacin, kanamycin, and 6-APA); see Figure 2—figure supplement 3A–C. The light red-shaded region indicates the number equal to zero (i.e., population extinction). When we repeated these experiments using a microfluidic device, we again observed population fluctuations (Figure 2—figure supplement 2B–D). (D) Our model predicts that the probability of population extinction increases linearly with death rate, with the slope being 1 / λ (the solid line). We experimentally characterized the extinction probability (Figure 2—figure supplement 4), and the death rate (Figure 2—figure supplements 5–6), at different concentrations of bactericidal drugs. Using these data, we obtained the relationship between the extinction probability and the death rate, and plotted it here (green circles: cefsulodin, pink squares: ofloxacin, and grey triangles: 6-APA). We found good agreement between the model prediction and experimental data. Note that at increasing drug concentrations, λ changed little (Figure 2—figure supplement 6B), and thus was taken as a constant in the analysis here.
Figure 2—figure supplement 1
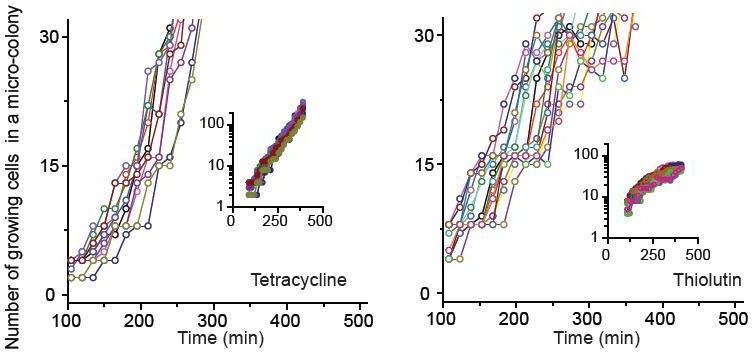
We characterized how cells grew and formed micro-colonies at sub-MIC levels of bacteriostatic drugs (chloramphenicol, thiolutin, and tetracycline) at single-cell resolution.
See Figure 2 and its caption for details. The data for chloramphenicol were plotted in Figure 2B. The data for tetracycline (0.7 × MIC) and thiolutin (0.5 × MIC) were plotted here. The data were replotted on a semi-log scale (insets). In our plate assay (data shown in Figure 1A), we plated cells on agar containing increasing concentrations of bacteriostatic drugs and, after 18 hr of incubation, counted the number of visible colonies. The lowest drug concentrations yielding no visible colonies were defined as the MIC. When we performed our microscope experiments at the MICs of bacteriostatic drugs, we observed that some cells still grew, albeit at very low rates, and micro-colonies expanded very slowly. After 18 hr, the colonies reached the size less than 200 µm (estimated from the microscope image). This is too small and difficult to detect with the naked eye, which was why we failed to notice in our plate assay. Also, at these concentrations of chloramphenicol and tetracycline, we observed filamentation of some cells. Some of these filamentous cells divided and produced normal-looking daughter cells, which grew properly afterwards. There were also filamentous cells that did not resume normal growth within our observation window (~24 hr).
Figure 2—figure supplement 2
Previously, we developed a microfluidic chemostat for cell culture (Kim et al., 2012; Deris et al., 2013).
We cultured E. coli cells in this device. Our microfluidic chemostat has about one hundred micro-chambers. We inoculated these chambers by loading single cells into them and then exposed them to 0.8 × MIC of various drugs. Then, using time-lapse microscopy, we recorded how one cell in each chamber grew and formed a population. (There were chambers that were initially inoculated with multiple cells. We did not record cell growth in such chambers). By counting the number of cells at different times in each chamber, we determined the trajectory of population size for each population.
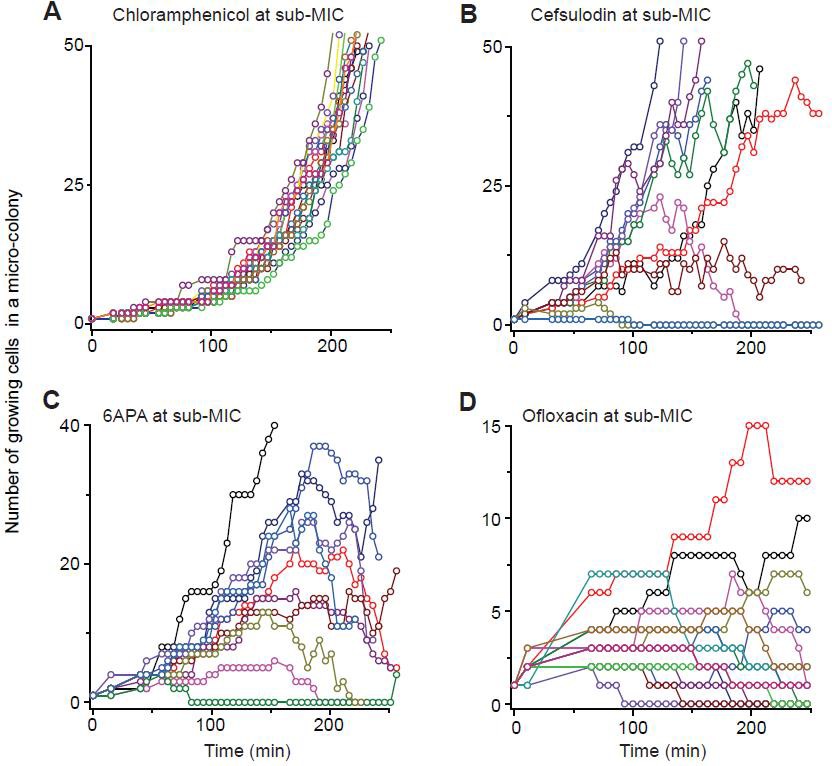
Figure 2—figure supplement 3
We show population dynamics of bacteria exposed to bactericidal drugs (0.8 × MIC or 1.2 × MIC).
See Figures 2C and 3A, and their captions for details.
Figure 2—figure supplement 4
As discussed in the main text, we analyzed single-cell-level image sequences, and counted the number of colonies that went extinct.
Here, we plotted the probability of colony extinction (P0) at different drug concentrations (green circles: cefsulodin, pink squares: ofloxacin, and grey triangles: 6-APA).
Figure 2—figure supplement 5

We determined the rates of cell growth λ and death ϕ at sub-MIC drug concentrations, by analyzing the time-lapse microscopy images of colony growth.
Here, we described our determination procedure using the data from 0.8 × MIC of cefsulodin as an example. As shown in the Video 3, live cells continued to elongate and divide. Every now and then, these cells underwent lysis (i.e., cell death). We counted the number of live cells,, and the number of dead cells, , in each colony. We then averaged them across ~20 colonies, which yielded a temporal trajectory for and another trajectory for . Equation A9 predicted that increases exponentially over time, and this prediction was supported by a linear pattern in the temporal semi-log plot; see panel A (a linear regression analysis was performed, resulting in the blue line (slope = 0.0058, intercept = −0.556, R-squared = 0.9971)). The slope of this linear increase is determined by (See Equation A9). Equation A12 predicted a linear relation between and , and this prediction was supported by a linear pattern in panel B (a linear regression analysis was performed, resulting in the green line (slope = 0.6770, intercept = −0.998, R-squared = 0.9896)). The slope of this linear pattern is equal to(see Equation A12). Analyzing these slopes, we determined λ and ϕ to be 1.35/hr and 0.54/hr. We repeated this procedure for various drug concentrations, as well as for other drugs. The results were plotted in Figure 2—figure supplement 6.
Figure 2—figure supplement 6
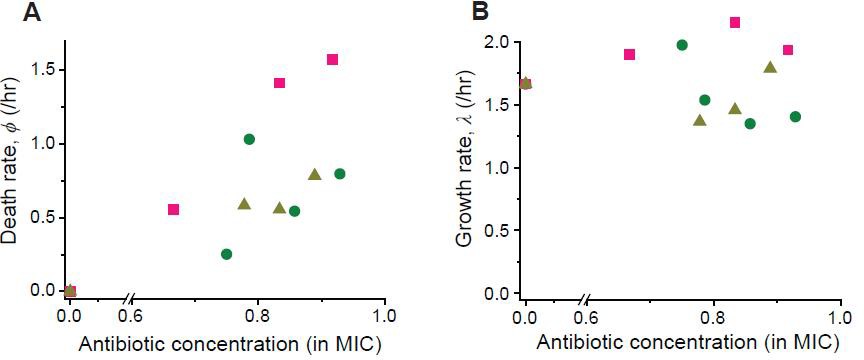
Following the procedure described in Figure 2—figure supplement 5, we determined the rates of cell growth λ and death ϕ at different drug concentrations (green circles: cefsulodin, pink squares: ofloxacin, and grey triangles: 6-APA).
https://doi.org/10.7554/eLife.32976.013
Figure 3
Further characterization of stochastic population dynamics.
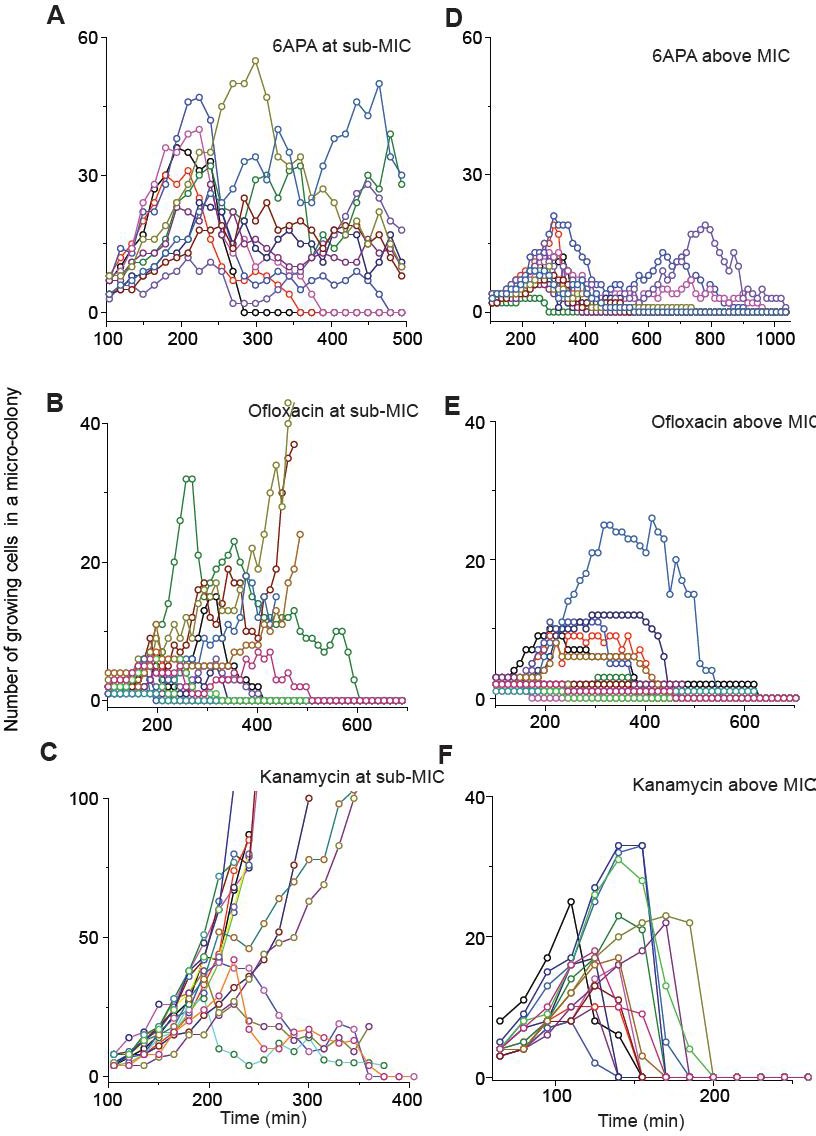
(A, B) In Figure 2C and Figure 2—figure supplement 3A–C, we showed the population dynamics of bacteria exposed to sub-MIC levels of bactericidal drugs. Here, we show the dynamics at drug concentrations above MIC (1.2 × MIC). The number of growing cells within micro-colonies for cefsulodin is plotted in panel A. The results for other bactericidal drugs were plotted in Figure 2—figure supplement 3D–F. We observed that all populations went extinct at various times. We then counted the number of live colonies (colonies that have not undergone extinction yet) at various times (~150 colonies monitored). The number decreased gradually over time (green circles: cefsulodin, pink squares: ofloxacin, and grey triangles: 6-APA); see panel B. The decrease was linear in a semi-log plot, consistent with the model prediction of an exponential decay (Equation A7). (C) We characterized the extinction probability of populations starting with ~640 cells. We prepared a large volume of a cell culture with the cell density of ~640 cells/ 200 µL, supplemented the culture with a low concentration of cefsulodin (23 µg/ml), and then distributed 200 µL of the cell culture equally to 12 isolated chambers in a microtiter plate. We repeated this procedure using higher cefsulodin concentrations (but maintaining the inoculum size). We then incubated the microtiter plate overnight. By counting the chambers that became turbid or clear, we calculated the extinction probability. We used a heat map to graphically represent the probability; for illustration purpose, we also added the values of the probability to the plot. At low cefsulodin concentrations (to the left of the dashed line), all chambers became turbid (P0 = 0). At high concentrations (to the right of the solid line), all chambers were clear (P0 = 1); thus, the solid line indicates MIC. At intermediate concentrations (between the dashed and solid lines), we observed heterogeneous results (only some chambers were clear, 0 < P0 < 1). (D) We repeated this experiment using different inoculum sizes and bactericidal drugs. Please note that although we prepared a large volume culture and distributed it equally to chambers, the number of cells in each chamber might vary. We found that the variation was ~10% or less. See Appendix 3 for details.
Figure 4 with 4 supplements
Increasing the population-extinction probability by a growth reduction strategy.
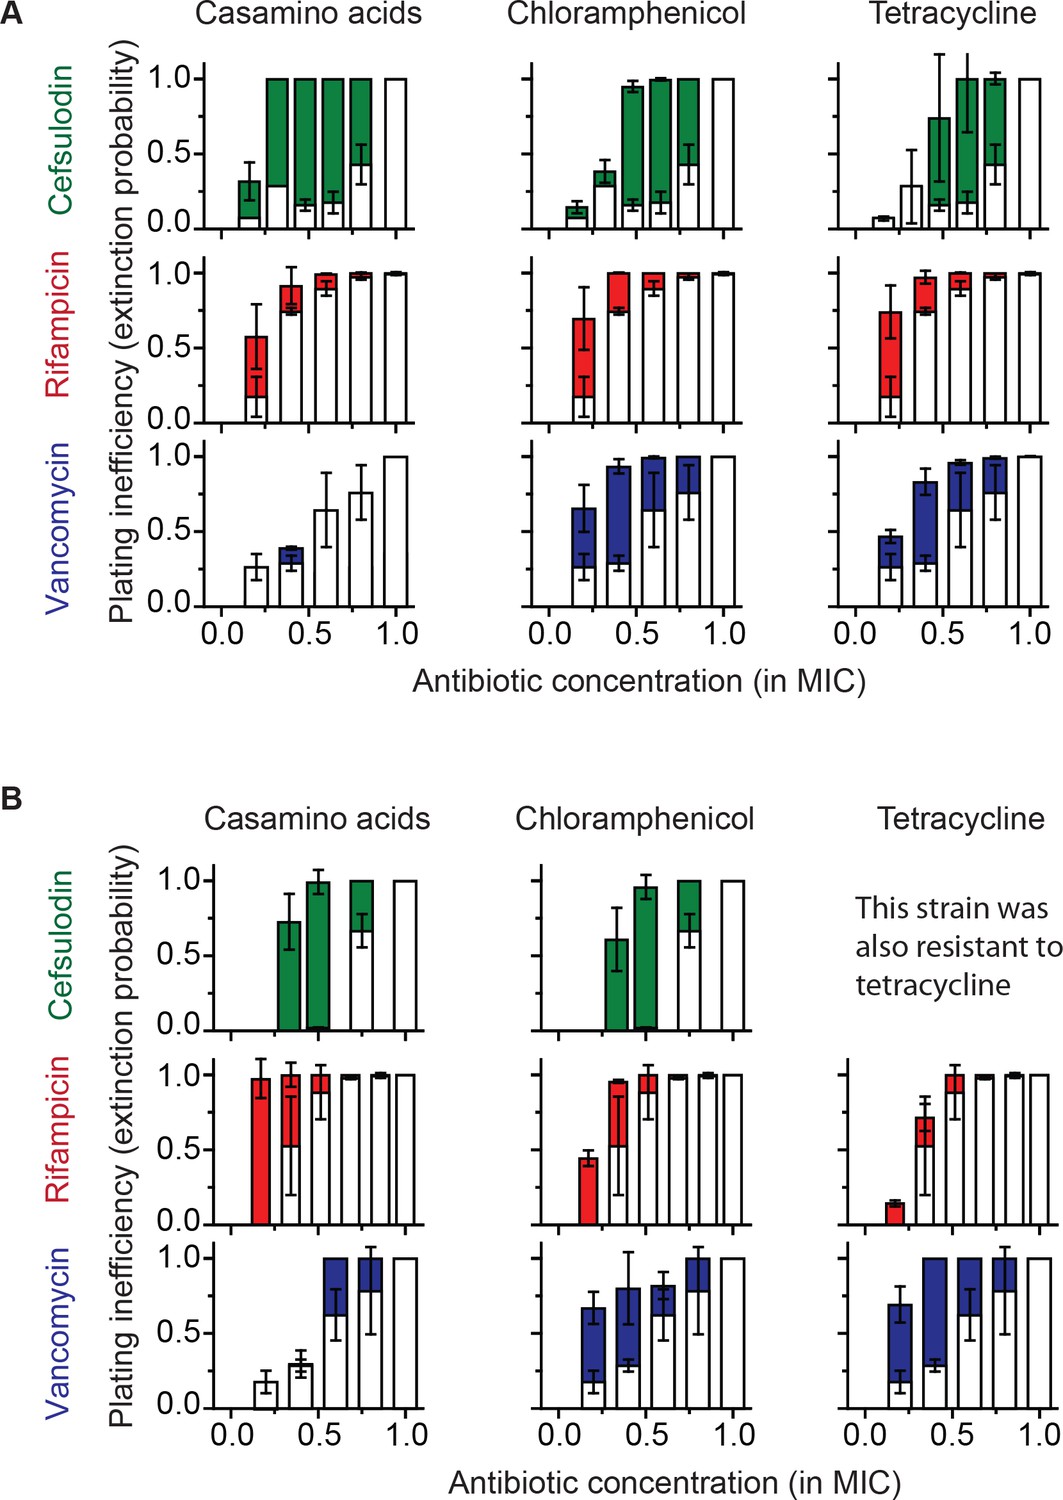
(A, B) Previously, we plated WT (antibiotic-susceptible) E. coli cells on LB agar plates at various concentrations of cefsulodin and plotted the plating efficiency in Figure 1B. Here, we plotted the plating inefficiency (1- plating efficiency) as white columns in the top row; the plating inefficiency represents the extinction probability. We then repeated a plate assay, either by using casamino acids agar plates (left), or by adding a sub-MIC concentration of a bacteriostatic drug, chloramphenicol (0.7 × MIC, middle) or tetracycline (0.5 × MIC, right), to LB agar plates. Note that casamino acids lead to slower growth than LB; see Figure 4—figure supplement 1. We plotted the plating inefficiency obtained with these treatments as solid columns in panel A. We repeated this procedure for rifampicin (middle row) and vancomycin (bottom row), for kanamycin and 6-APA (Figure 4—figure supplement 3), and for ciprofloxacin and ofloxacin (Figure 4—figure supplement 4). Note that how generally growth reduction leads to an increase in the extinction probability depends on whether ϕ is dependent on λ or not; see the main text and Figure 4—figure supplement 2. We then used antibiotic-resistant strains and repeated these experiments (panel B). Please note that the MICs of these mutants were five to ten fold higher than those of the WT strain. The rise of solid columns above white columns indicates an increase in the extinction probability. We performed at least two biological repeats for all the experiments and plotted the mean. The error bars represent one standard deviation from the repeats.
Figure 4—figure supplement 1
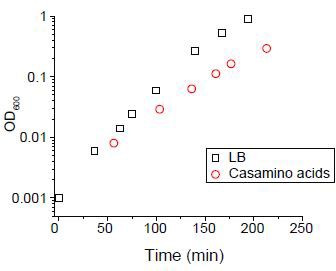
We cultured cells in either LB medium or N-C- medium supplemented with 2% of casamino acids (Csonka et al., 1994).
The doubling time was 18 mins and 33 min respectively.
Figure 4—figure supplement 2
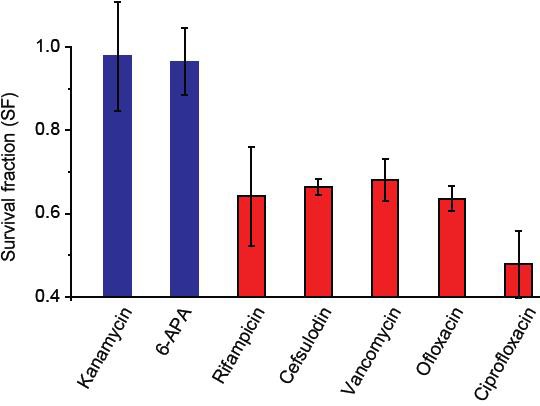
We measured MICs of bactericidal drugs using exponentially-growing cultures and confirmed that at 1.5 × MICs, all growing cells were eradicated; that is, survival fraction (SF) was equal to zero.
We then stopped cell growth in cultures by depriving the cells of nutrients, added 1.5 × MICs, and measured SF. SF was one for kanamycin and 6-APA (blue columns), indicating that they were not capable of killing non-growing cells. Other drugs (red columns) were capable of killing non-growing cells, but with lower efficacy as SF was not zero. Lower susceptibility of non-growing bacteria to drugs has been previously documented (e.g., see (Levin and Rozen, 2006)). We performed two biological repeats and plotted the mean. The error bars represent one standard deviation from the repeats.
Figure 4—figure supplement 3
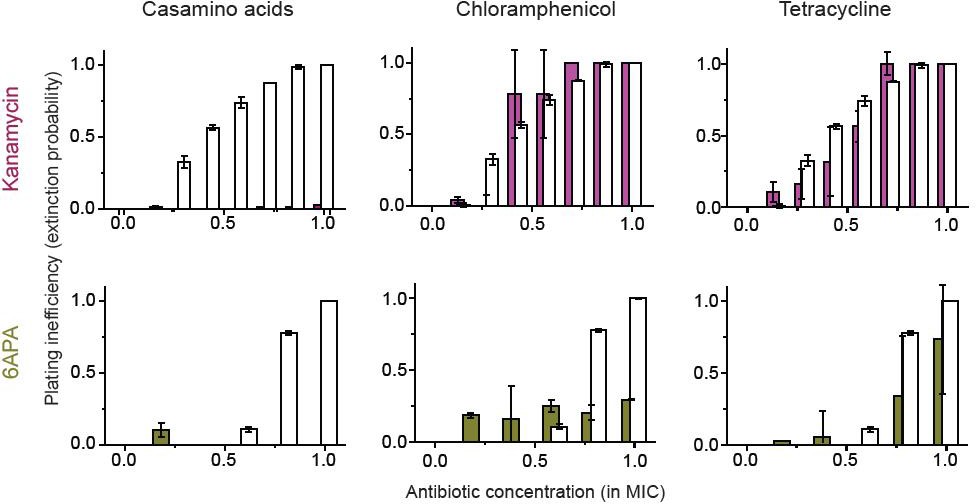
In Figure 4—figure supplement 2, we found that kanamycin and 6-APA do not kill non-growing cells (i.e., ϕ→ 0 when λ→ 0).
Here, we show that the growth reduction strategy does not work for these two antibiotics. White columns indicate the plating inefficiency without the growth reduction treatment. The solid columns are with treatment. In the figure, overlapping columns were from the same drug concentrations, but their centers were shifted to visualize both white and solid columns. Please see the main text and the caption of Figure 4 for detail. We performed two biological repeats and plotted the mean. The error bars represent one standard deviation from the repeats.
Figure 4—figure supplement 4
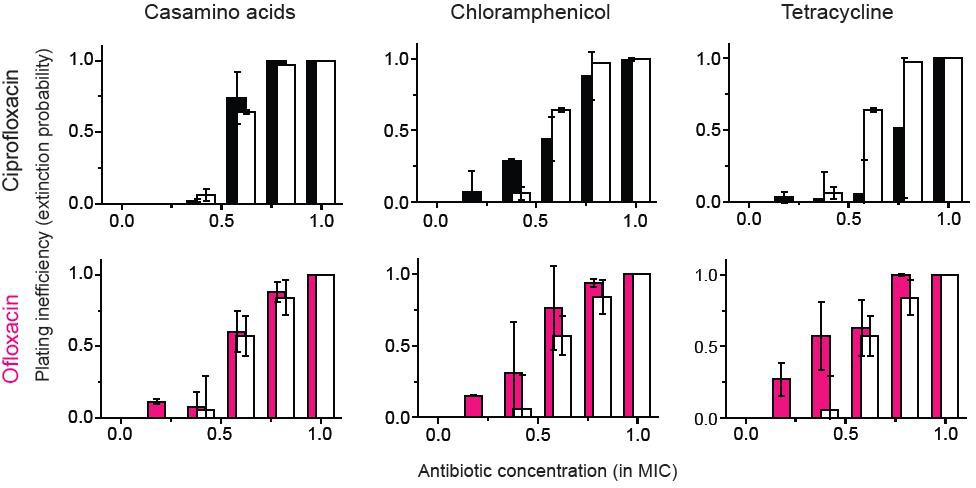
A previous study showed bacteriostatic translation-inhibiting drugs and bactericidal quinolone drugs affect gene expression in a way to negate their effects (Bollenbach et al., 2009).
The figure shows that for ofloxacin or ciprofloxacin (quinolone drugs), the growth reduction strategy did not lead to a significant change in the extinction probability, consistent with the previous study. We performed two biological repeats and plotted the mean. The error bars represent one standard deviation from the repeats.
Author response image 1

Videos
Video 1
The growth of micro-colonies in the absence of a drug.
We characterized how cells grew and formed micro-colonies on LB agar using time-lapse microscopy. An example image sequence is shown here. The time interval between each frame is 20 min.
Video 2
The growth of micro-colonies with a bacteriostatic drug
We characterized how cells grew and formed micro-colonies on LB agar using time-lapse microscopy. 0.7 × MIC of chloramphenicol was used. An example image sequence is shown here. The time interval between each frame is 19 min.
Video 3
The growth of micro-colonies with a bactericidal drug
We characterized how cells grew and formed micro-colonies on LB agar using time-lapse microscopy. 0.8 × MIC of cefsulodin was used. An example image sequence is shown here. The time interval between each frame is 15 min.
Tables
Appendix 3—table 1
Percent variation of inoculum size in a microtiter plate.
https://doi.org/10.7554/eLife.32976.028| Average inoculum size | Standard deviation | Percent variation |
|---|---|---|
| 11.4 | 1.49 | 13% |
| 58.4 | 3.7 | 6.3% |
| 135.8 | 7.8 | 7.8% |
Additional files
-
Supplementary file 1
Minimum inhibitory concentration (MIC) for all drugs examined in this study
Source data: Source data for all figures
- https://doi.org/10.7554/eLife.32976.023
-
Transparent reporting form
- https://doi.org/10.7554/eLife.32976.024
Download links
A two-part list of links to download the article, or parts of the article, in various formats.
Downloads (link to download the article as PDF)
Open citations (links to open the citations from this article in various online reference manager services)
Cite this article (links to download the citations from this article in formats compatible with various reference manager tools)
Antibiotic-induced population fluctuations and stochastic clearance of bacteria
eLife 7:e32976.
https://doi.org/10.7554/eLife.32976


